The tangle of ageing populations and productivity growth - Remarks by Governor Gabriel Makhlouf, Central Bank of Ireland at the Society of Professional Economists
25 November 2024
Speech

Good evening.
I am delighted to speak here today, at the invitation of the Society of Professional Economists. It is always a pleasure to be back in London.
Connections between the Ireland and the UK – be they economic, political, cultural or familial, and often all four together – go back centuries. In central banking, the London connection stretches back to the earliest days of the Irish Free State. For the first half-century or so of Irish independence, the monetary systems of Ireland and the UK were fully integrated. A ‘London Agency’ located in the Bank of England was set up towards the end of the 1920s by the Currency Commission, a precursor to the Central Bank of Ireland. Initially, its main purpose was to allow for the exchange at parity of the Irish pound for Sterling, thereby preserving the so-called “link with Sterling”.1 Over time, the Agency evolved to become a forum for direct and confidential discussions on economic and financial developments of the day, contributing to what one former Governor described as the “intimate connection” between Ireland and the Sterling area.2
The London Agency is long gone, but I hope that my presence here today contributes to the enduring connection between two close neighbours. Though not so intimate a connection these days, the UK remains an important trading partner, accounting for some 15% of Irish trade, albeit far below the 50% share seen in the 1980s.3 And while Ireland is now part of another currency union with 19 other euro area countries, as two large financial centres there are common areas of interest, especially during crisis episodes.
The focus of my speech today is two inter-related challenges that will have a large bearing on economic policy in the coming years: demographic change and productivity growth.
The policy focus is naturally a European or euro area one, but these are also challenges for the UK.
With the December meeting of the ECB Governing looming, I first want to give a quick overview of the economic outlook.
Recent data make me increasingly confident of reaching our 2% inflation target during 2025, but the stickiness of services inflation and elevated wage growth leave some room for caution.
Services inflation has averaged around 4% this year in the euro area. With goods inflation around its long-term average of 0.5-1%, I want to see services inflation closer to 3% in order to be more in-line with our target.
In support of this, there are some signs of labour market loosening, which will help to ease upward wage pressures. Forward-looking surveys and wage trackers also point to a slowing of wage growth next year.
Measures of economic activity have been volatile. Third quarter GDP was towards the top-end of the range in our September projections. Against this, the November PMI was weak, along with data on new orders. Weaker growth is a downside risk to inflation, and we will know more after the updated Eurosystem staff projections in December. It is clear that policy remains restrictive and, shocks aside, rates are on a downward trajectory. Given the volatility in the data and the substantial uncertainty regarding economic policy in trade partners, I remain open-minded on the slope of this downward trajectory. This is in line with our data-dependent approach to setting policy.
A tangle of challenges – where to begin?
In his recent career retrospective, Edmund Phelps talks about the “tangle of challenges […] calling for society’s attention and the attention of policy makers”.4 ‘Tangle’ is apt: a multitude of challenges that inter-mingle with one another, creating knots that can be hard to untie. And in this entanglement, we are increasingly seeing cyclical fluctuations – typically the primary interest of monetary policy – interacting with ongoing structural trends. More and more, it can be hard to know where the cyclical ends and the structural begins.
At the recent IMF meetings, we heard about many of the current threats facing the global economy: the fragmentation of trade, increasing conflicts and geopolitical uncertainty, demographic change and ageing populations, weak productivity growth especially in Europe, the rise of AI and what it means for inclusive growth, workers and society, and, of course, climate change.
Without downplaying the importance of each of these, demographic change and productivity growth deserve special attention.
Ageing societies and falling birth rates have profound implications for growth, consumption, savings, investment, and long-term interest rates. The headwinds from a smaller working age population will, in turn, put even greater pressure on productivity enhancing investments to deliver growth and sustain living standards.
Demographic change: slow, slow, quick-quick, slow
Population change tends to be slow moving, driven by developments in birth, death and ageing rates. In this sense, it shares some of the long-horizon characteristics that stymie policies to address the impact of climate change.
But, much like climate change where the effects on society and the economy are all too apparent now, we are already into what I call the ‘quick-quick’ phase of demographic change. Over the coming decades, the population structure in many countries will go through a very rapid transition phase, culminating in a far larger retired and elderly population.
For Europe, the peak of the population pyramid fades over the rest of this century (Chart 1). The most rapid shift occurs over the next 25 years, with dependency ratios – the population aged 65 and over as a proportion of the population aged 15-64 – increasing from 0.33 in 2022 to 0.58 in 2050 (Chart 2).
Ireland’s population is ageing at a faster rate than almost any other European country.5 Having had dependency rates significantly below the European average for decades, by the middle of this century Ireland will significantly close the gap with several of its continental neighbours.
Chart 1 | Population pyramids: EU 2022 and 2100
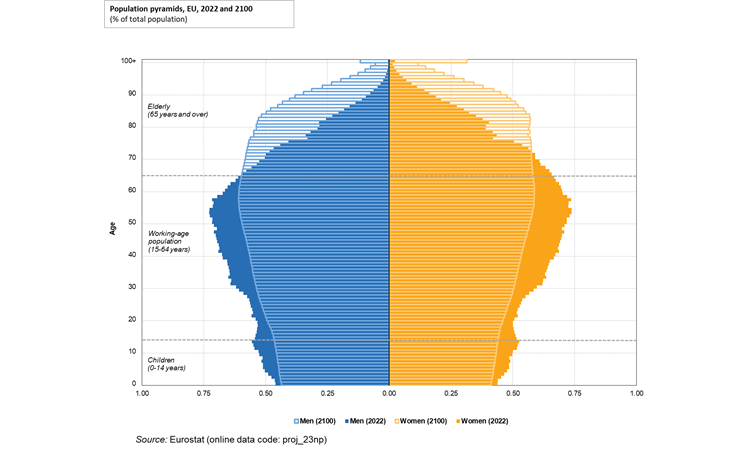
Chart 2 | Dependency ratios for selected countries
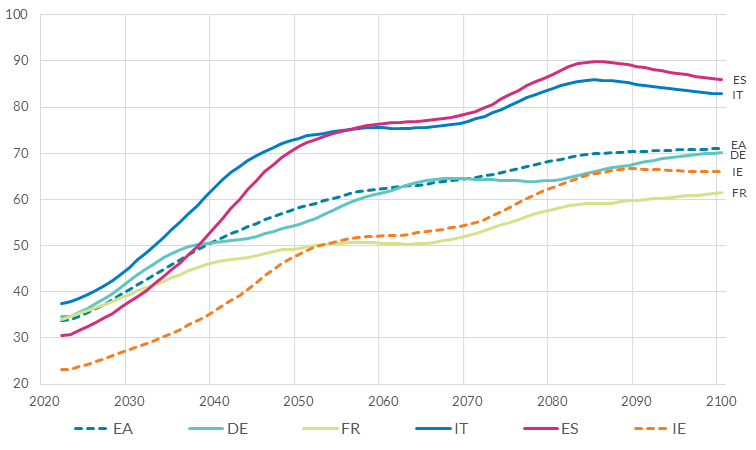
Source: Central Bank of Ireland calculations using Eurostat baseline population projections (2023). The dependency ratio is the number of people aged 65 and over as a proportion of people aged 15-64.
Demographics dragging on growth
A shrinking working age population is a headwind for growth, both directly – via savings behaviour and reduced labour supply – and indirectly via the impact of government spending (and taxes) needed to fund pensions and healthcare. Intergenerational social contracts will be tested, putting pressure on the ability of governments to fund spending commitments for older population groups.
During the 2020s, a growing labour force contributes to just over a third of growth in national income, or one percentage point (Chart 3a). Current population projections have this falling steadily to around a half of a percentage point in the 2030s, before reaching a negligible contribution in the 2040s and beyond. For the euro area, the contribution of the workforce to growth is already negative from the 2030s onwards (Chart 3b). Researchers estimate the (negative) contribution to annual output growth from demographics over the period 2020-40 to be -0.76 percentage points for Germany, -0.37 for France, -1.07 for Italy, and -0.35 for the United Kingdom.6 Importantly, these growth accounting exercises focus on just demographic effects, and do not account for many other factors that can impact growth.
For example, policies and technologies that increase labour participation, such as working beyond typical retirement age or boosting female labour force participation, can help offset some of these effects.
A related question is what greater longevity might mean for economic activity and productivity if that longevity is primarily a result of people leading healthier lives. Dependency ratios that assume over-65s are ‘retired’ could be over-stating the challenge if greater longevity due to healthier living is also correlated with wanting to carry on working for much longer. The impact on dependency ratios from using a ‘retirement age’ of 75 instead of 65 is large: in the euro area, the ‘+75’ dependency ratio in 2050 is 0.35 instead of 0.58 (‘+65’); in Ireland it ‘falls’ from 0.48 to 0.25. These comparisons are likely the upper-end of any such upside scenarios, but they do illustrate the potential benefits to policies that support and incentivise working-for-longer.
If people choose to work longer, it could also up-end how we traditionally think about human capital accumulation and individual productivity growth, especially in older-age working groups. If a middle-aged worker instead expects to be working into their seventies, this could incentivise education and training throughout their working life, rather than the general practice of it ending in their 20s.
In summary, addressing the coming demographic challenge is not just about looking for alternative sources of growth – such as productivity, which is the focus of the remainder of my speech – but also re-assessing how we think about ‘retirement’ and human capital accumulation over the life cycle.
Chart 3 | Decomposition of projected long-term growth estimates
(a) Ireland
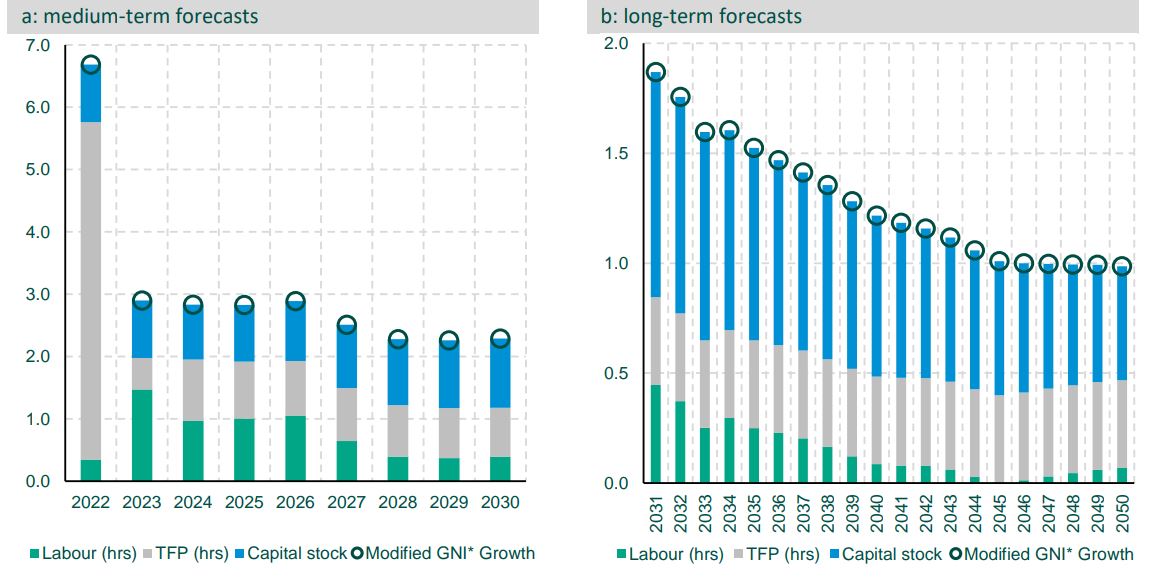
(b) Euro area

Source: (a) Horizon Scanning – calibrating medium to long-term economic projections, Department of Finance (October, 2023). (b) Central Bank of Ireland calculations based on the European Commission 2024 Ageing Report: Economic and Budgetary Projections for the EU Member States (2022-2070). Figures are for average growth in the specified year and the following four years, except for 2022, which is 2022-24. Capital deepening is the change in the ratio of capital to labour.
Implications of ageing populations for inflation and monetary policy
Demographics influence long-term inflation trends, operating through labour supply, productivity and savings.
Inflation itself could be lower because of ageing populations. Research shows that having a larger elderly population (aged 75+) is deflationary.7 Ageing populations can put downward pressure on the natural interest rate as a result of increased savings can also constrain the ability of monetary policy to react by reducing headroom. Of course, it could also be the case that running down savings during retirement could also have the opposite effect, that is, drive up the natural rate of interest.8
Productivity developments, and innovation in particular, can also be impacted by an ageing population. Patent applications – a proxy for innovation and productivity growth – are positively affected by the share of the middle-aged and negatively by retirees.9 These direct effects of demography on innovation and growth can be amplified via endogenous growth dynamics and real wage rigidity, which can erode competitiveness.
Another growth-related risk from ageing populations is the potential crowding out of public investment spending, as ageing populations place even greater demands on the public purse. The European Commission estimates the change in the annual total cost of ageing between 2022 and 2070 to be around 5% of GDP in Ireland and 2% in the euro area, with most of this front-loaded in the next twenty years.10 These are substantial cost increases, when we compare with public investment rates of between 2 and 4% over recent decades.
The transmission of monetary policy is also impacted by changes in the structure of the population that change the credit and consumption mix. An older population means fewer mortgaged households and more spending on less cyclically sensitive services like healthcare. As older consumers devote a larger share of their spending to products with higher price rigidity, this contributes to a higher degree of aggregate price stickiness as the population ages.11
Productivity growth matters for potential output growth and the natural rate of interest. It is therefore also an important factor influencing the environment in which monetary policy operates, specifically its effectiveness, how it transmits to economic activity and how much room it has to manoeuvre.12
Monetary policy itself could impact productivity, as investment decisions can affect the supply-side of the economy. Although, as I discuss further, the long-run effects of monetary policy remains a topic of some debate among economists and policymakers.
Finding Europe’s productivity groove
In the face of such demographic headwinds, there is an even greater emphasis on productivity to deliver growth. And yet productivity growth in Europe is weak, and has been for some years, raising fundamental questions regarding the sustainability of European living standards.
From the perspective of a central banker, a first important thing to understand is the extent to which the low growth in productivity is due to cyclical or structural factors. The large shocks that we experienced in recent years affected both supply and demand factors, but overall they suggest that the cyclical component has certainly been an important factor for the slowdown in productivity, especially labour productivity.
In the euro area, post-Covid labour market adjustment was primarily through a sharp fall and then a gradual recovery in real wages. Thus, while tighter monetary policy dampened economic activity in recent years, employment growth was relatively unaffected. This short-term departure from Okun’s law led mechanically to a fall in labour productivity.13 ECB Staff Macroeconomic Projections assume an unwinding of these cyclical factors in 2025 and 2026, which, together with lower profit margins, is expected to support disinflation in the euro area.14
The main driver of the long-run slowdown in European productivity growth is a decline in total factor productivity (TFP) growth.15 TFP growth depends on innovation, by both incumbent and new entrant firms, and the extent to which inputs are efficiently allocated between firms. TFP growth in the United States is well above that of European economies, with the gap widening over the last 25 years.16
One reason for this divergence is higher research and development (R&D) investment in the US (Chart 4).17 US businesses in particular, spend considerably more on R&D, at 2.8% of GDP compared to 1.5% for European firms (Chart 5). As the Draghi report showed, the biggest differences relate to R&D spending in computing and technology (ICT), in both ICT manufacturing and, increasingly, ICT services (Chart 6). The acceleration in US firms’ R&D spending in ICT services since 2017 is stark, now almost on a par with R&D investment in ICT manufacturing.
Outside of ICT, R&D spending by euro area firms is marginally larger as a share of GDP, compared to US firms. In 2021, almost two-thirds of this is in non-ICT manufacturing, with a further 20 per cent in non-ICT business services.
Chart 4 | R&D spending (% GDP)
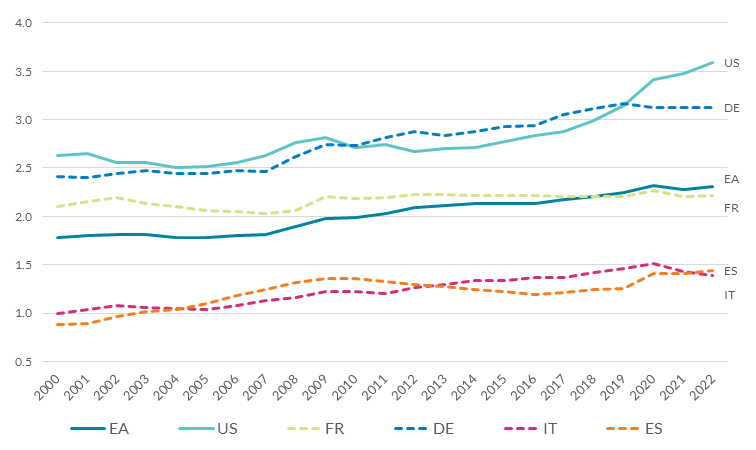
Source: Central Bank of Ireland calculations using Eurostat GERD statistics. Last observation is 2022.
Chart 5 | R&D investment spending by investor type (% GDP)
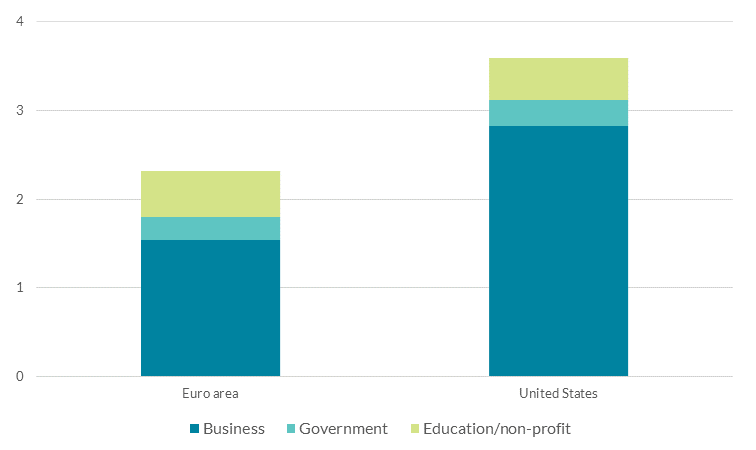
Source: Central Bank of Ireland calculations using Eurostat GERD statistics. Last observation is 2022.
Chart 6 | Business R&D investment spending by broad sector (% GDP)
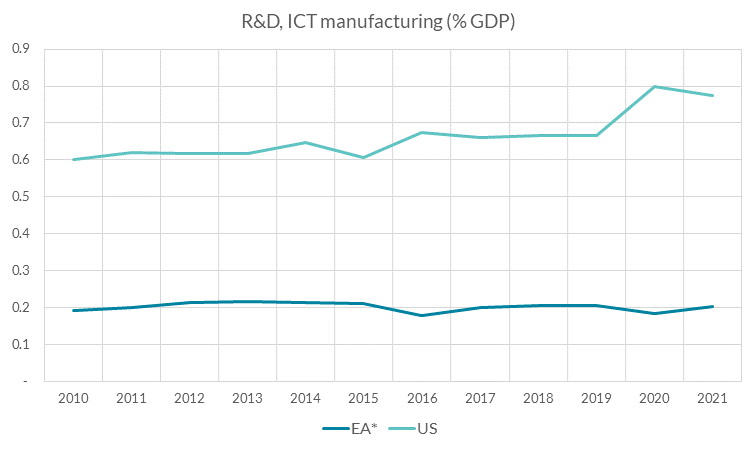
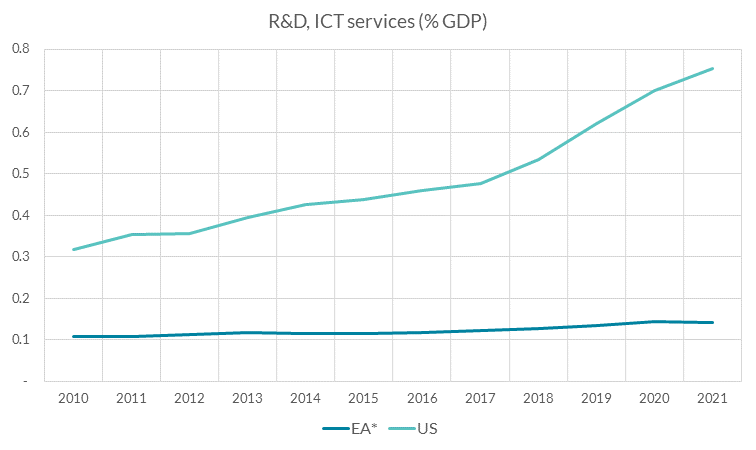
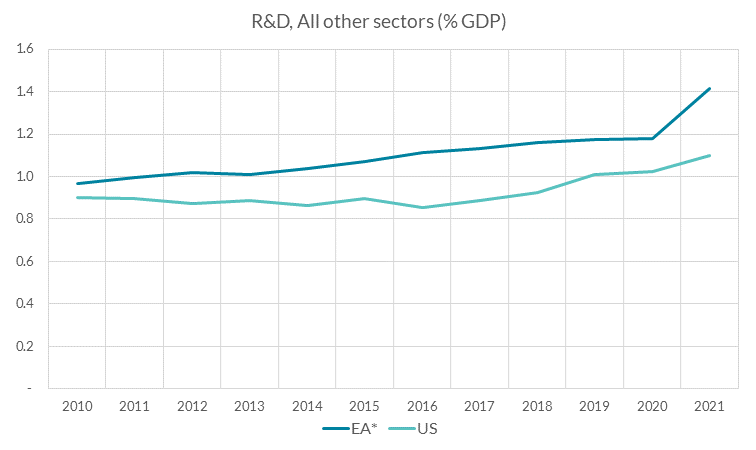
Source: Central Bank of Ireland calculations using Eurostat GERD statistics. Last observation is 2021. (*) EA here refers to Germany, France, Spain and Italy, which, combined, account for 73% of business investment in R&D in the euro area in 2021.
We can distinguish between productivity gains in existing businesses and gains through “creative destruction”, that is where less efficient firms are replaced by more productive new start-ups.
Relative to the US, Europe has a less dynamic business sector, with lower firm entry rates and a smaller share of young firms, both in terms of number of firms and employees. Low levels of renewal at the firm level can result in a greater share of firms falling significantly behind the technology frontier. Research has shown that around one-quarter of the growth in US productivity is attributable to firm renewal.18
The recent IMF European Outlook attributes a relative lack of business dynamism to two factors: market size and access to finance19. Both feature in the Draghi and Letta reports on competitiveness and the single market, which call for long-discussed reforms to the institutional architecture of the Economic and Monetary Union to boost productivity. This is in keeping with the recent history of central bankers emphasising the need for structural reforms since the Global Financial Crisis. In some cases, this went beyond expressing opinions. For example, a necessary condition for Outright Monetary Transactions is adherence to “strict and effective conditionality” in ESM programmes that typically have a strong focus on structural reforms.
Looking ahead, there is no avoiding the structural adjustment that will be required to boost productivity. Facing a rapidly changing global economic environment, it is high time to enact reforms that spark Europe’s productivity growth.
Closing the innovation gap
While the need to boost productivity growth is clear, the role of monetary policy in the coming adjustment is perhaps less so.
Conventional wisdom maintains that monetary policy is neutral in the long run. For example, a lowering of interest rates to increase aggregate demand will eventually translate into higher prices rather than greater output. However, there is an increasingly large body of work challenging this view, spurred-on by the coincidence of a failure of productivity growth to recover to the pre-Global Financial Crisis trend and monetary policy reaching the effective lower bound.
This work essentially demonstrates how short-term, demand-focused policies can have persistent effects on the supply side of the economy.20 For instance, one direct channel through which monetary policy can affect firms’ incentives to develop and implement innovations is through the cost of financing.21 This mechanism is particularly effective in credit-constrained environments.22 Research also suggests that, relative to labour inputs, both TFP and the capital stock have a greater tendency for hysteresis, which can give rise to asymmetry. In other words, monetary tightening shocks can have a greater impact on longer-run growth than loosening shocks.23
These connections points to the need for monetary policy to be at least cognisant of potential effects it can have on the supply side features of the economy, especially over the medium term.
But how might this work in practice, and what are the potential challenges?
Our monetary policy framework relies heavily on several unobservables to calibrate the stance.
The output gap is one example. Approaches to estimating the gap tend to assume slow-moving potential output that is only shifted by permanent shocks.24
However, we also know that innovation and business dynamism can be pro-cyclical, especially for young businesses that are sensitive to financial market conditions.25 The strong transmission of our recent monetary tightening to business investment suggests that interest rate decisions now can have effects beyond the current cycle.26
One option is to consider tracking metrics such as the innovation gap, which is the difference in productivity between frontier and laggard firms.27 When domestic demand is strong (i.e. a small or positive output gap), but the innovation gap is large, firms may invest in new technological and production techniques developed elsewhere, instead of raising prices although the choice itself is affected by the monetary policy stance. The opposite happens when demand is weaker: there is less incentive to invest and a gap develops amongst firms. Monitoring the innovation gap would provide policymakers with a sense of the potential spillovers from demand conditions to productivity growth. It is also in line with a recommendation from the Draghi report that, while Europe does not have to be a world leader in every sector, it should at least speed up the adoption of best practices developed elsewhere.
Let me be clear, I am not suggesting that the innovation gap should be incorporated into our reaction function. There are many challenges with this, not least that policy makers would need to be confident that spending on innovation is productivity enhancing, and over what time-horizon.
But we do need to know how the innovation gap in Europe varies over the cycle, including the various aspects of investment and business dynamism that contribute to the gap, such as R&D spending, start-ups, venture capital investment and share of employment in young firms. Only then can we begin to monitor how it is changing over time, and to what extent it is impacted by monetary policy and how much it impacts monetary policy.
Monetary policy is not the only show in town
To facilitate the coming structural adjustment, we require substantial coordination of all our policy instruments: fiscal, structural, industrial and monetary. While monetary policy can affect the cost of financing, it is not the only show in town. One example is the structural impediments to the smooth intermediation of funds to innovative projects. The long-touted Capital Markets Union – now rebranded as the Savings and Investment Union – is a prime example. Even in the presence of accommodative monetary policy, it is not clear that financing would flow to the most productive projects. Several cross-border barriers remain.
Policies that seek to boost productivity and innovation must be complemented by completion of the EU Single Market. We need to remove the remaining barriers to trade in goods and, especially, services. A deeper and stronger single market will, in turn, boost the returns to investment. The headline annual spending estimates of €800 billion from the Draghi report naturally caught a lot of the attention. However, the report also highlights the large gap between private saving and productive investment in Europe, which contributes to a substantial current account surplus. Higher returns for investment within the EU will help to close some of this gap.
Beyond monetary policy, central banks can support innovation in other ways.
One example is the provision of a secure pan-European payment infrastructure offering central bank digital money.
As the Letta report makes clear, a digital euro is a key element of a deeper and stronger single market, fostering cross-border relationships that will boost competitiveness. Another important benefit is that private providers and new entrants will be able to access the digital euro infrastructure, enabling innovation in payments and consumer financial services. The Singapore Fintech Festival, which I attended recently, shows how rapidly the payments landscape is changing, driven by both technological and business model innovation. Europe and its citizens cannot afford to be left behind.
Conclusion
Europe is at a pivotal moment in its economic development.
The tangle of ageing populations with weak productivity growth raise questions about the long-term growth outlook.
On demographics, change is coming, but we should also look beyond current thinking on dependency ratios that generally assume ‘retirement’ at 65. Increased longevity as a result of healthier lifestyles presents opportunities for our citizens to have longer working lives, should they so choose. Policies to incentivise working longer, alongside promotion of life-long learning, need to be part of our thinking.
But demography is only part of the tangle of challenges facing policymakers today. We are familiar with the other major transitions – our changing climate, the digitalisation of our economies – and are becoming familiar with newer ones such as the fragmenting global economy and the weakening of the rules-based international order. The need to build economic resilience to both short-term shocks and longer-term transitions become self-evident by the day.
Productivity is at the heart of building that resilience. The Mario Draghi and Enrico Letta reports present a menu of policy options to help boost competitiveness, and the European Commission has taken note.
All aspects of policy – fiscal, structural, industrial and monetary – have a role to play. For central banks, it will become increasingly important to quantify how innovation is impacted by, and impacts, monetary policy. For the payments system, a pan-European payment infrastructure via central bank digital money will provide the rails to both deepen and strengthen the single market, while also providing opportunities for innovation in payments and other financial services.
The tangle of challenges ahead will be hard to untie. Economists need to be at the heart of the untying, applying analytical rigour to evidence and ignoring the siren of alternative truths or policy-based evidence-making. At the same time, economists will have to, as Keynes wrote, “escape from habitual modes of thought and expression” and be prepared to consider paradigms that challenge us, avoiding the temptation to stop at economic ideas that leave us feeling comfortable.
It’s through working together – whether in academia, in business, in policy – that we can help our communities through the tangle of challenges ahead.
[1] See Kelly J. (2003) “The Irish Pound: From Origins to EMU (PDF 720.75KB)” for more on history of modern currency and monetary arrangements in Ireland.
[2] “Currency and Central Banking in Ireland”, by Maurice Moynihan (1975), pages 129, 210.
[3] On Ireland-UK trade, including the impact of Brexit, see Conefrey (2021 (PDF 238.2KB) and 2024 (PDF 487KB)).
[4] “My Journey’s in Economic Theory”, Edmund Phelps (2023). Page 180.
[5] The UK follows a broadly similar path to Ireland (see OBR, 2022). This leaves it with a relatively less aged population than other Southern European and Asian countries, but the rate of change is one of the steepest in Europe, with an 18 percentage point increase in the dependency ratio by 2070.
[6] Cooley, T. F., Espen H., and C. Nusbaum (2024) “Demographic obstacles to European growth.” European Economic Review 169.
[7] Juselius, M., and E. Takáts (2021), “Inflation and demography through time” Journal of Economic Dynamics and Control 128: 104136.
[8] The idea that the baby boomer generation could dissave when they retire is a key theme in Goodhart, C. and Pradhan, M. (2020), “The Great Demographic Reversal,” Economic Affairs, Wiley Blackwell.
[9] Aksoy, Y., et al. "Demographic structure and macroeconomic trends." American Economic Journal: Macroeconomics 11.1 (2019): 193-222.
[10] European Commission 2024 Ageing Report: Economic and Budgetary Projections for the EU Member States (2022-2070).
[11] Mangiante, G., “Demographic Trends and the Transmission of Monetary Policy” (Banca d’Italia, 2024).
[12] The ECB 2021 Strategy Review workstream on “Key factors behind productivity trends in EU countries” (Lopez-Garcia et al, 2022) outlines the various macro and micro drivers of productivity, as well as its importance for monetary policy.
[13] Arce and Sonderman (2024) “Low for long? Reasons for the recent decline in productivity” for an analysis of the cyclical variation in productivity before, during and after Covid.
[14] ECB Staff Macroeconomic Projections, September 2024.
[15] Fernald, Inklaar and Ruzic (2023): “The Productivity Slowdown in Advanced Economies: Common Shocks or Common Trends?” A lack of investment in capital (i.e. capital deepening) has also played a role. See for example, Van Reenen and Yang, 2023 (for the UK) and Lopez-Garcia, 2022 (for the euro area).
[16] Fernald, Inklaar and Ruzic (2023), using data to 2019.
[17] IMF (2024) “How to Awaken Europe's Private Sector and Boost Economic Growth”.
[18] Foster, Lucia, John C. Haltiwanger, and Cornell John Krizan. “Aggregate productivity growth: Lessons from microeconomic evidence.” New developments in productivity analysis. University of Chicago Press, 2001. 303-372. The share of US employment in young (age<=5 years) has declined in recent years, as has US productivity growth. Though it remains above European levels, in large part due to higher rates of growth in high-tech firms.
[19] IMF Regional Report: Europe (October 2024).
[20] Benigno, G and L. Fornaro (2018), “Stagnation Traps”, The Review of Economic Studies 85(3): 1425-1470.
[21] Moran, P and A, Queralto (2018), “Innovation, productivity and monetary policy”, Journal of Monetary Economics 93: 24-41.
[22] Aghion, P., E. Fahri and E. Kharroubi (2019), “Monetary Policy, Product Market Competition and Growth”, Economica 86: 431-470.
[23] Jorda, O., Singh, S. R., and A. Taylor (2024), “The long-run effects of monetary policy”. As presented at the ECB conference on “Monetary Policy 2024: bridging science and practice”.
[24] Measuring the output gap and gleaning the signal for policy makers is not without its challenges. We had the counter-intuitive situation during 2023 of rising core inflation but negative or zero output gaps, as reported by international institutions such as the IMF, OECD and European Commission. Incorporating what firms were telling us at the time – that production capacity was fully utilised given the persistent supply shocks – a more intuitive positive gap emerges. See Bodnár et al. (2020) and González-Torres (2023) for analyses of output gap estimates during this period.
[25] See Ma Y. and K. Zimmerman (2023), “Monetary Policy and Innovation” (presented at the Kansas City Fed Jackson Hole Symposium, 2023) for an overview of the cyclicality of innovation. The discussion by Haltiwanger (2023) highlights some of the policy and data challenges that arise when talking about monetary policy and innovation.
[26] Jarvis, V. and B. Shirato (2024), “What do recent surveys reveal about euro area business investment in 2024?”. ECB Economic Bulletin, Issue 5/2024.
[27] Addressing the innovation gap is, arguably, the ultimate aim of the policy proposals in the Draghi and Letta reports, although there is less of a focus on monetary policy. In an monetary policy context, Wren-Lewis (2018) argues that, for the UK, the large innovation gap that opened up post Global Financial Crisis (GFC) weakened the link between aggregate demand (i.e. the output gap) and inflation because “firms are likely to meet additional demand not be raising prices but by investing in these more efficient techniques”.