Transcript of the video Quarterly Bulletin 3 2025 Irish Economic Outlook (PDF 87.35KB)
Comment
As a new trans-Atlantic economic relationship begins to emerge, businesses, households and policy-makers in Ireland continue to adapt to this changed environment. While the economic outlook is not as favourable as it would have been had US tariffs not been introduced, effective tariff rates now in place covering EU-US trade are at the lower end of the wide array of outcomes that seemed possible earlier in the year. Although lessened, policy uncertainty still remains relevant both domestically and globally. The momentum behind Irish economic growth is expected to ease through this transition to a new external environment. At the same time, supply-side constraints to sustainable growth in the domestic economy remain prominent. These will require a concerted policy effort to address them appropriately. Doing so alongside fostering local business dynamism and strengthening Ireland’s de facto integration into the EU single market will make the economy more robust to a more fragmented geopolitical environment over the longer term and maintain the economy’s attractiveness to FDI.
The strength of headline GDP in the first half of 2025 in part reflected multi-national enterprises’ (MNEs’) responding to potential US tariffs by front-loading exports. However, as noted in the previous Quarterly Bulletin, there was also an underlying impetus to exports arising from the expanding pharmaceutical industry in particular, as well as growth in non-pharma exports. Looking ahead, the manner in which affected MNEs react to increased costs due to higher tariff and non-tariff barriers will influence key indicators of the Irish economy. In addition to fluctuations in economic activity, MNE profits and the relative balance between goods and services trade in both value and volume terms may experience volatility in the near-to-medium term. Rising production and distribution costs could eventually weigh on the profitability of MNEs in Ireland over the medium term, having a negative impact on corporation tax revenues compared to recent trends. However, in the near term, and in the absence of any changes to domestic and international policy, corporation tax receipts are likely to rise, while the underlying budget deficit excluding excess corporation tax receipts is expected to deteriorate further.
Over the longer term, particularly if tariffs are accompanied by broader changes to US tax and industrial policies, there is a risk of lower investment flows and restructured MNE value chains. This could hinder growth in real economic activity and employment in Ireland, further exacerbating challenges for the public finances. In a Signed Article published alongside this Bulletin, staff research points to the prospect of Irish national income being in the region of 1 per cent lower over the long-term with the new US tariff regime now in place than would otherwise be the case. The potential impact notably differs across sectors, with models pointing to more negative outcomes for the foreign-dominated pharma and chemicals sectors, while the food and beverage sector is the most significant of the domestically-dominated sectors affected. The analysis suggests that tariffs of the magnitude now being introduced are unlikely to lead to any significant reduction in existing foreign investment, but the potential loss of Ireland’s attractiveness as an export platform for new US FDI remains a key risk over the medium term.
The domestic economy overall continues to be resilient so far in 2025, with revised National Accounts data from the CSO re-confirming our view from the March Bulletin on the momentum in the economy through the first half of the year. Employment growth continues to exceed 2 per cent and unemployment remains relatively low. Domestic inflationary pressures remain contained, although food price inflation has been relatively high lately due mainly to tighter supply conditions in European beef markets (Box A). Continued expected growth in real disposable incomes over the forecast horizon, amid a stable labour market, supports the expected continued growth in consumer spending.
However, some signs of easing momentum are emerging. The private sector job vacancy rate has fallen and growth in economic activity in the domestically-oriented sectors of the economy has been moderate in the first half of 2025. While external policy uncertainty may be weighing on the domestic economy, the economy’s potential sustainable growth is being materially constrained by key infrastructure gaps in water, energy, transport and housing. The persistent gap between the supply of and demand for housing services sees house prices and rents increasing at a faster pace than incomes. With expectations for house prices playing an important role in forming Irish consumers’ overall inflation expectations, risks remain that developments in the housing market not only constrain economic growth but also feed into inflation being higher than would otherwise be the case (Box B). Overall, risks to the economic growth outlook, while more balanced than in the June Bulletin, are still tilted to the downside.
Euro area inflation is currently at around the 2 per cent medium-term target, and the ECB Governing Council’s assessment of the inflation outlook was broadly unchanged following their meeting in September compared to the previous policy-setting meeting. In light of the incoming data, the dynamics of underlying inflation and the strength of monetary policy transmission, the Governing Council at that meeting decided to maintain the deposit facility rate unchanged at 2 per cent.
The near-term challenges and longer-term impacts of the shifting geoeconomic landscape bring to the forefront the need for clear priorities in domestic economic policy.
For the near-term, broad fiscal supports are neither necessary nor appropriate, given the nature of the shock and the underlying vulnerabilities in the public finances. Instead, working within the existing parameters of State agencies, indigenous exporting firms—already among Ireland’s most successful and productive businesses—can be supported to develop new networks and markets. Notably, Irish businesses have untapped potential for trade with other EU Member States, leveraging the world’s largest tariff-free market (Central Bank of Ireland, 2025 (PDF 1.4MB)). Collaborating with EU policymakers to reduce intra-EU trade and investment barriers could unlock these opportunities. This includes advancing the Savings and Investment Union (SIU), which would help households in Ireland and across the EU achieve higher returns on savings, while offering more funding options for businesses. Additionally, further integration of European payment systems could reduce trade frictions, benefiting both Irish businesses and households.
Addressing the long-term challenges posed by geoeconomic fragmentation requires tackling the same constraints to domestic growth noted above by closing infrastructure gaps in water, energy, transport, and housing. This is essential to improve Ireland’s attractiveness for foreign direct investment and to contain the costs of living and doing business. Efficient public infrastructure delivery, achieved not only through increased capital expenditure but also reforms that would accelerate project timelines, can crowd-in private investment. However, the necessary rise in construction activity—a sector with below-average productivity—poses short-term risks of higher unit labour costs and inflation. To mitigate these risks, linking public capital spending to innovative delivery methods and incentivising scale in investment projects is important. Such initiatives can support productivity, ease inflationary pressures, and maximise the economic benefit from public investment. More generally, facilitating greater business dynamism and more efficiency in capital re-allocation as young firms emerge will also contribute to higher productivity growth.
Reducing the risks to the public finances from an excessively narrow tax base has become more critical, given the reliance on corporation tax receipts from a small number of MNEs, which may be more vulnerable in light of geoeconomic fragmentation. The Commission on Taxation and Welfare Report in 2022 presented viable options for maintaining and increasing the breadth of the tax base across tax reliefs, property and consumption taxes and social insurance contributions, while preserving where appropriate the degree of progressivity in the personal income tax system. Establishing the Future Ireland Fund and the Infrastructure, Climate and Nature Fund only partially addresses known additional public expenditure pressures that will emerge in the 2030s and beyond. Committing to a credible fiscal anchor that ensures sustainable growth in net government expenditure remains essential. This would establish effective counter-cyclical fiscal policy, enabling the public finances to support the economy as needed, and strengthen the public finances over time. Growth in government expenditure, especially recurring current expenditure, needs to be accompanied by a sustainable revenue-raising base given the vulnerabilities arising from persistent spending overruns and underlying budget deficits. Additionally, broadening the tax base is necessary to create the fiscal and economic capacity to increase public capital investment as envisaged in the National Development Plan and to cover the rising costs that are emerging to sustain public services at their existing levels.
Outlook for the Irish Economy
Recent Developments and Forecast Summary
The economy has grown rapidly in the post-pandemic period based on new CSO data. Annual National Accounts data for 2024 (published by the CSO on 8 July 2025) show that the economy, as measured by real modified Gross National Income (GNI*), grew by 4.8 per cent last year. Economic growth was broad-based with higher exports and activity in the multinational-dominated sectors adding to already steady growth in domestic demand. Since 2021, annual average growth in real GNI* of 6.9 per cent per annum has been recorded, well above the economy’s estimated potential growth rate. The rapid pace of growth in the post-pandemic period means that the overall size of the economy – based on GNI* in nominal terms – increased by 55 per cent (or almost €115 billion) between 2019 and 2024. The equivalent increase in real (constant price) terms was 27 per cent or €65 billion.
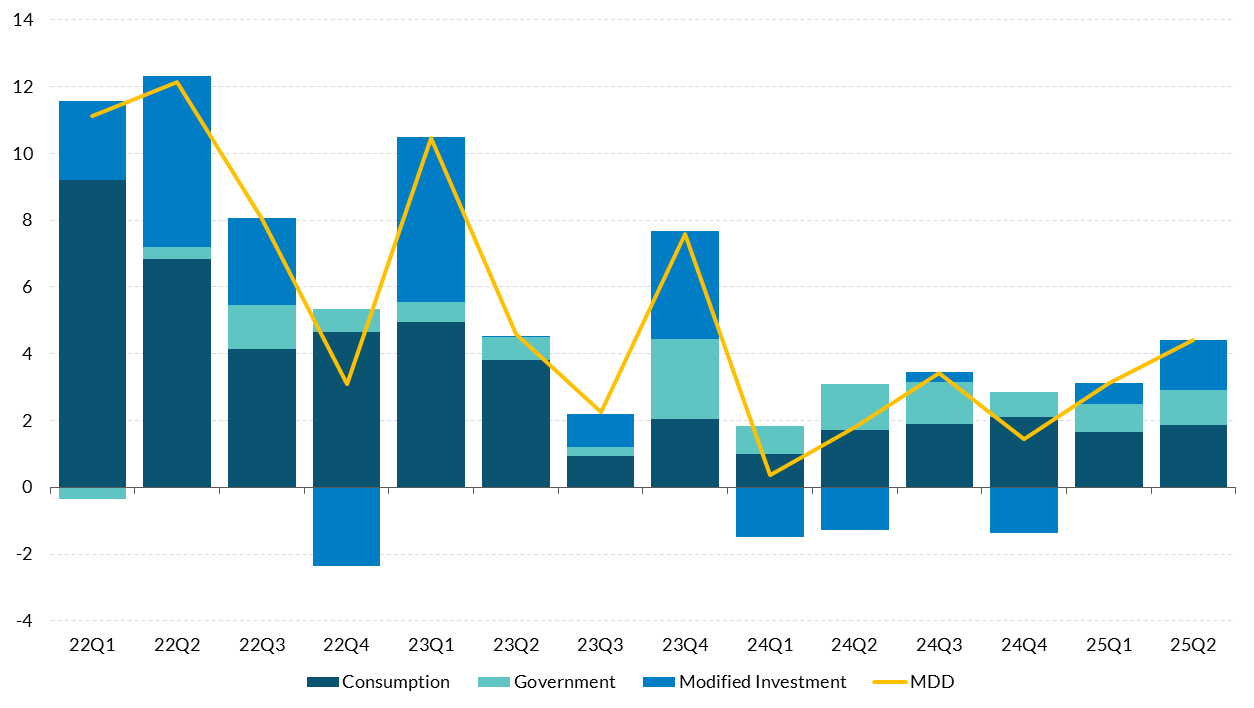
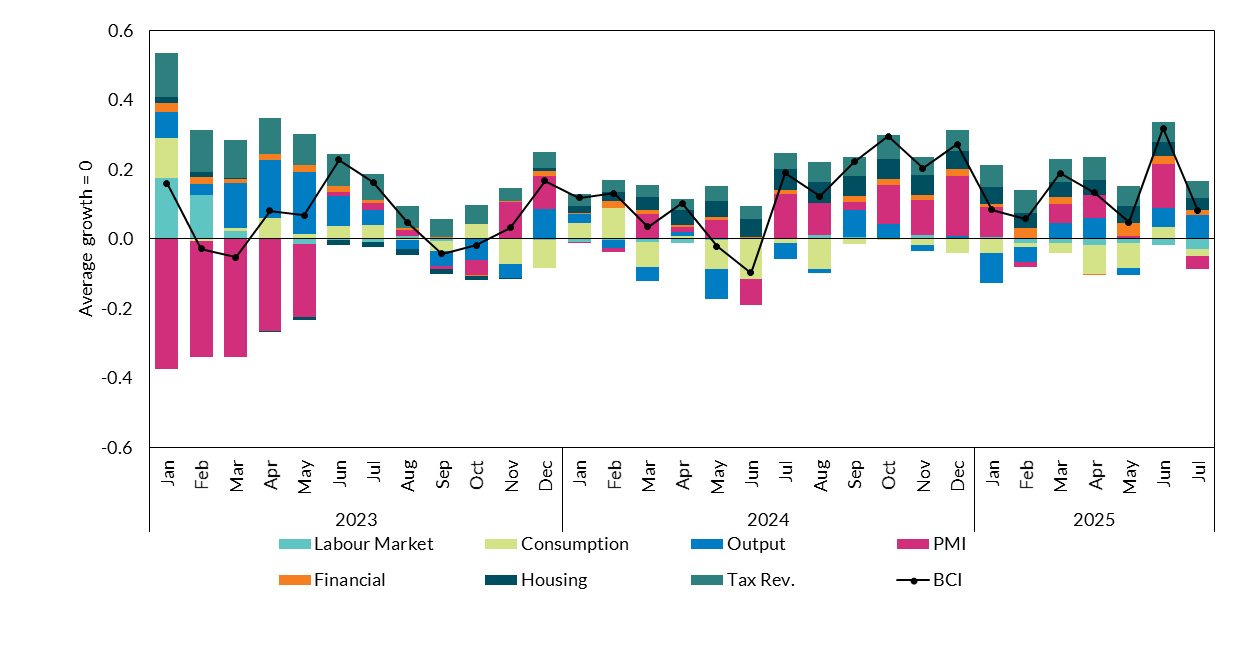
Despite external headwinds and historically high uncertainty, the economy continued to grow steadily in the first half of 2025. The latest data for the first half of 2025 show that economic activity continues to expand. Modified Domestic Demand (MDD) grew by 3.8 per cent in the first six months of 2025 compared to the same period of 2024, with employment up 2.8 per cent (Figure 1). Consumption grew by 1 per cent in Q2 on a seasonally-adjusted basis, higher than the 0.2 per cent rise in Q1. Modified investment recorded a small quarterly decline in Q2 after increasing by 13 per cent in Q1 in the revised data. This component of demand is volatile in nature and prone to revision. Looking at the output side of the National Accounts, activity in the domestically-oriented sectors expanded by 1.5 per cent in the first half of 2025 compared to the same period in 2024, signifying a weaker pace of expansion in domestic activity than indicated by MDD. The Central Bank’s Business Cycle Indicator (BCI) summarises the information from the latest high-frequency monthly data, separating out the underlying trend in activity from movements due to noise. The most recent data show that the BCI remained in positive territory in July and has been broadly flat since the start of 2025 (Figure 2). The level of the BCI in 2025 is consistent with continued growth in domestic demand close to its long run average. The main positive contributions to the BCI so far in 2025 have been traditional sector output and tax revenues. PMI data provide survey information on activity levels in different sectors of the economy and these data contributed positively to the BCI up to June. In July, the PMI contribution turned negative due to a sharp slowdown in the construction sector activity measure. Weak consumer sentiment has also weighed on the BCI, partially offsetting the positive contributions from other high frequency data.
Pace of MDD growth remained steady in H1 2025
Figure 1: Contributions to year-on-year change in Modified Domestic Demand (MDD)
Source: CSO. Chart data in accessible format. (CSV 18.94KB)
The BCI indicates stable growth so far in 2025, consistent with continued growth in MDD
Figure 2: Business Cycle Indicator and Contributions, Average growth = 0
Source: Central Bank of Ireland. Chart data in accessible format. (CSV 0.84KB)
Note: Details on the methodology underpinning the BCI available here (PDF 790.91KB).
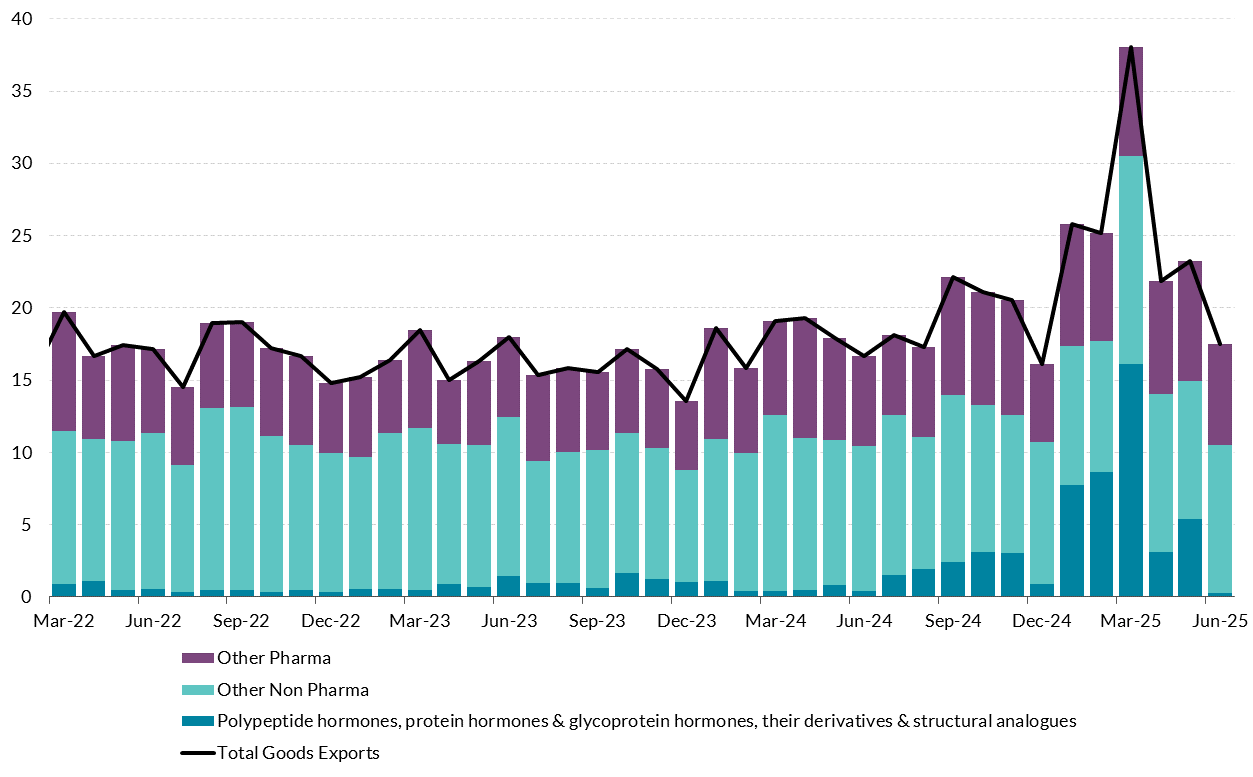
The outturn for net exports and GDP in 2025 is being impacted by volatility in pharmaceutical exports to the US. Goods exports from Ireland surged in the early months of 2025. For the first five months of the year goods exports to the US increased by 153 per cent compared to the same period in 2024, resulting in overall goods exports rising by 47 per cent. The increase was accounted for almost entirely by higher pharmaceutical exports. A significant part of the rapid increase likely reflected frontloading by pharma firms in Ireland in advance of the possible imposition of tariffs by the US on EU imports, later confirmed in July, in addition to new production lines coming on-stream in early 2025. Data for June show tentative evidence that frontloading activity stalled, with exports to the US in the month down by over 23 per cent compared to June 2024. It is possible that a further unwinding of the surge in exports observed up to May will continue in the coming months as firms use up stocks of pharma products already accumulated in the US. The extent and timing of any unwinding is uncertain, and also has to be weighed against the strong underlying growth in demand for the diabetes and weight-control drugs that are a prominent part of pharma export growth. Headline developments will be determined by the activities of a very small number of the largest pharma MNEs in Ireland.
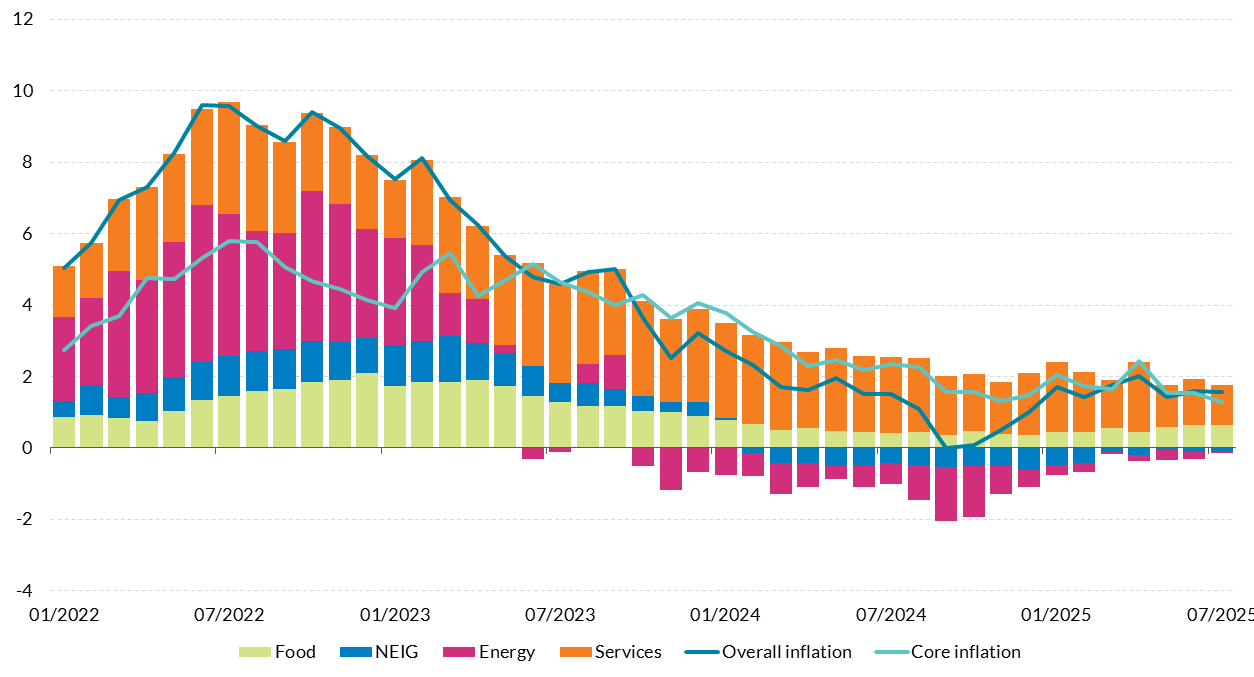
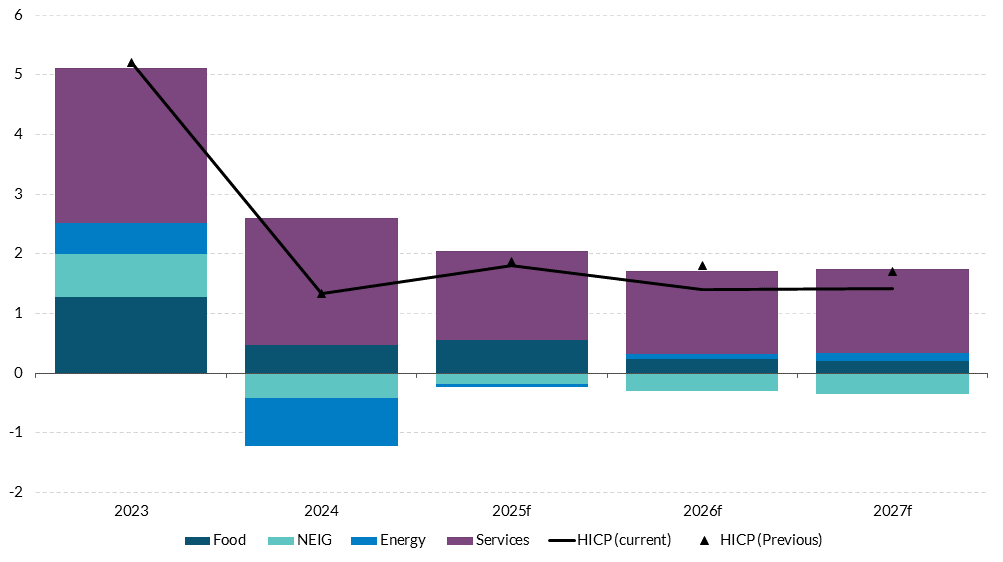
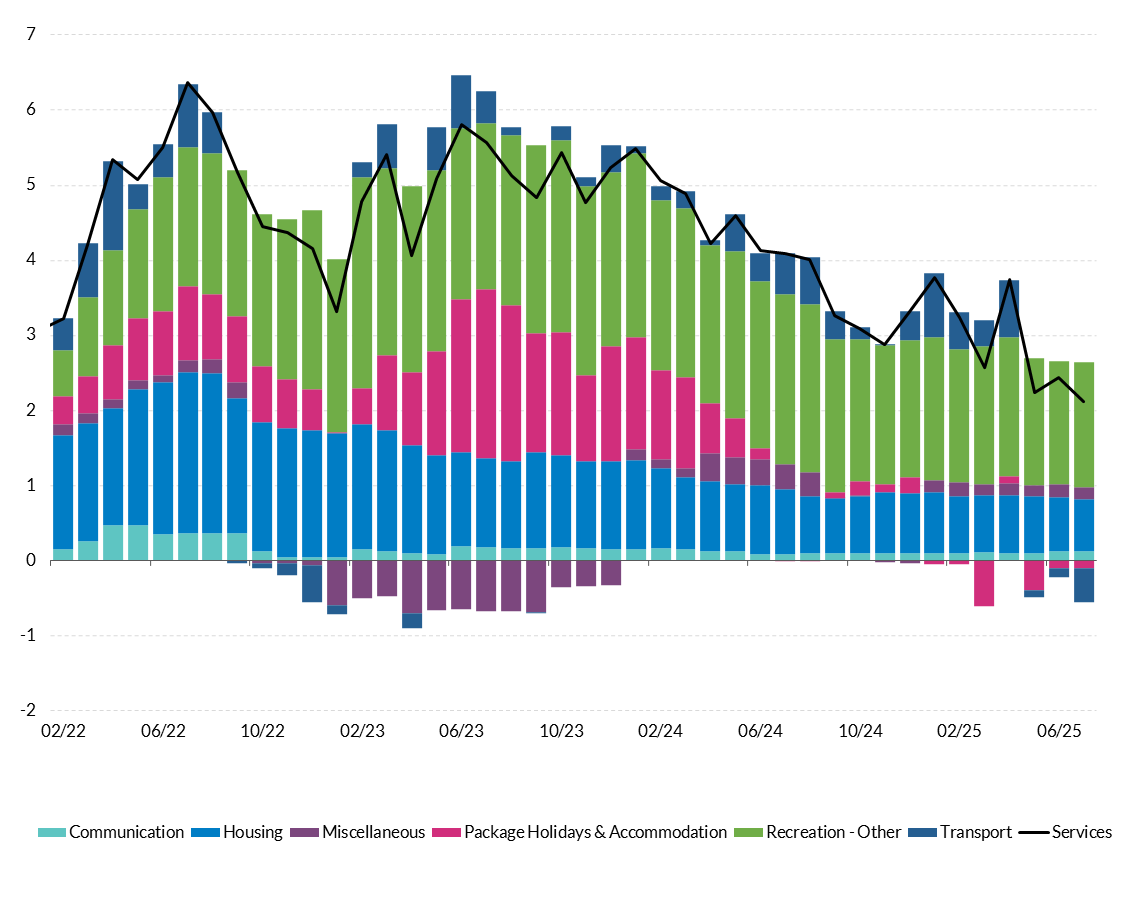
Headline inflation has remained steady at below 2 per cent up to August while measures of underlying inflation have eased. Headline inflation stood at 1.8 per cent in August compared to the same month in 2024 (Figure 3). The moderation in headline inflation largely reflects steady energy prices along with recent declines in services inflation, only partially offset by higher food inflation. The decline in services inflation is not broadly based but is concentrated in transport services. Overall services inflation up to July remains well above the headline rate, reflecting the extent of domestic demand, and the rate of increase in underlying inflation stands well above that observed in pre-pandemic period.
Headline inflation broadly steady at around 2 per cent in 2025
Figure 3: Contributions to headline inflation (year-on-year per cent change)
Source: CSO and Central Bank of Ireland. Chart data in accessible format. (CSV 1.59KB)
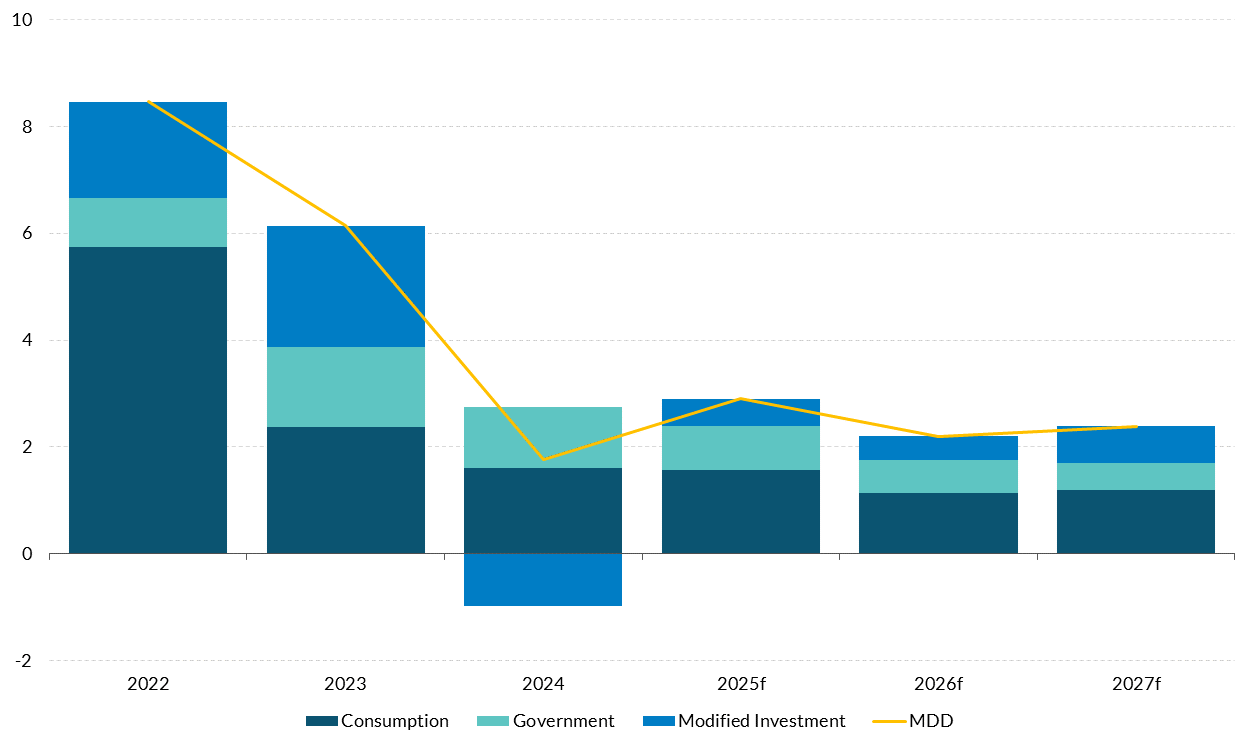
The economy is projected to continue to grow despite new tariffs on EU-US trade, more fragmented international trade generally and continued high levels of uncertainty. Some caution is warranted in interpreting the strength of the outturn for MDD in the first half of 2025. At 3.8 per cent, it is at the upper end of estimates of domestic growth available from a range of indicators including employment and domestic output. Nevertheless, on the whole, the outturn for the first half of 2025 indicates some positive momentum in economic activity. Combined with the stimulus to demand from the additional government expenditure announced in the Summer Economic Statement, this has resulted in an upward revision to the MDD forecast for 2025 to 2.9 per cent, with MDD forecast to grow by 2.2 per cent and 2.4 per cent in 2026 and 2027, respectively (Figure 4). Since QB2, tariffs of 15 per cent have been confirmed on US-EU trade, with pharmaceutical products included. Tariff rates above 15 per cent were announced by the US on other trading partners. These tariffs and more disrupted international trade are negative developments for a small open economy like Ireland and will lower growth relative to what could have been achieved with freer international trade. While some sectors will be more adversely affected than others, the current restrictions are not at a level that is prohibitive to trade and overall net exports are projected to contribute positively to growth over the forecast period. This is expected to be supplemented by continued, albeit gradually moderating, growth in domestic demand from increases in consumption and domestic investment. Putting these two elements together – the projection for net trade and domestic demand – Modified Gross National Income (GNI*) is forecast to grow by 2.5 per cent on average in real terms from 2025 to 2027 (Table 1). Headline inflation is projected to remain below 2 per cent out to 2027 (Figure 5).
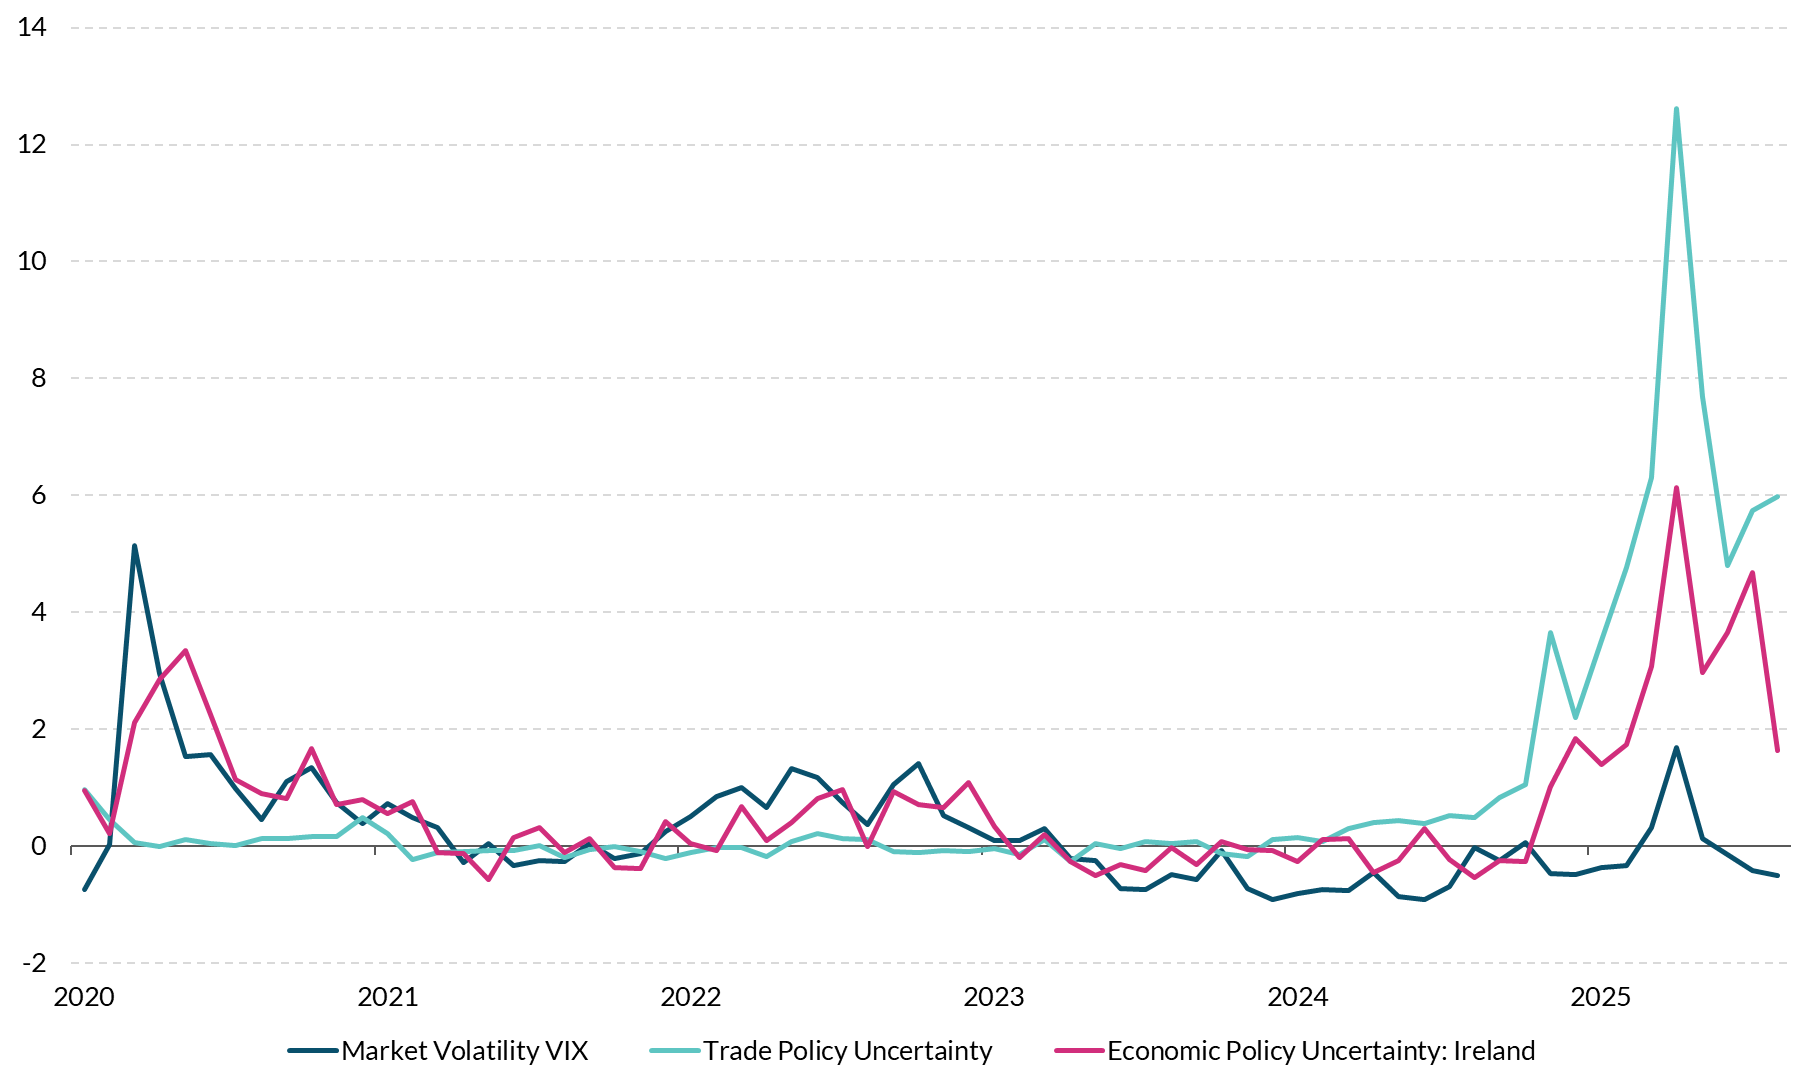
Risks to the growth outlook remain tilted to the downside, but are more balanced than in June. At the time of the last Quarterly Bulletin forecast in June, the level and coverage of potential US tariffs on the EU was uncertain with a range of outcomes possible. At least in this respect, the EU-US agreement has reduced uncertainty and avoided potentially higher tariffs than could have emerged without an agreement. Nevertheless, as a small open economy with extensive trade and foreign direct investment (FDI) linkages with the US, clear downside risks to economic growth in Ireland remain from the potential for a further escalation in global trade tensions from that observed to date (see Central Bank of Ireland, 2025 (PDF 1.4MB)). Economic policy uncertainty, which reached a record high in April 2025, has declined but remains well above historical norms (Figure 6). The projections assume that uncertainty gradually declines to a lower level in line with its 2018 average by the end of the forecast period. If this decline occurs more quickly or if economic activity remains more resilient in the face of such uncertainty – as was partially observed in H1 2025 – then the growth outlook would improve modestly relative to the central forecast. In the near term and contingent on any major negative external shock being avoided, there is a risk that existing capacity constraints could worsen further if there are delays in addressing current infrastructure deficits. This could result in higher and more persistent inflation in the near term and would lead to slower economic growth over the medium term. An overly expansionary fiscal stance could aggravate capacity constraints and would increase the fragility of the public finances if corporation tax revenues were to decline.
Table 1: Forecasts: QB3 2025 Forecast Summary and Revisions from June 2025 Baseline Projections
| | 2023 | 2024 | 2025f | 2026f | 2027f |
|---|
Constant Prices | | | | | |
| Modified Domestic Demand | 6.1 | 1.8 | 2.9 | 2.2 | 2.4 |
| Modified Gross National Income (GNI*) | 5.7 | 4.8 | 2.6 | 2.2 | 2.7 |
| Gross Domestic Product | -2.5 | 2.6 | 10.1 | 3.8 | 4.2 |
| Total Employment | 3.4 | 2.7 | 2.1 | 1.9 | 1.8 |
| Unemployment Rate | 4.3 | 4.3 | 4.6 | 4.8 | 4.9 |
| Harmonised Index of Consumer Prices (HICP) | 5.2 | 1.3 | 1.8 | 1.4 | 1.4 |
| HICP Excluding Food and Energy (Core HICP) | 4.4 | 2.3 | 1.8 | 1.4 | 1.4 |
Revisions from previous Quarterly Bulletin, p.p | | | | | |
| Modified Domestic Demand | 3.5 | -0.9 | 0.9 | 0.1 | 0.2 |
| Gross Domestic Product | 3 | 1.4 | 0.4 | 1.2 | -1.4 |
| HICP | 0 | 0 | -0.1 | -0.4 | -0.3 |
| Core HICP | 0 | 0 | -0.1 | -0.4 | -0.3 |
MDD forecast to grow over the medium-term though the balance of risks is to the downside
Figure 4: Contributions to annual change in MDD
Source: CSO, Author’s Calculations. Chart data in accessible format. (CSV 3.48KB)
Headline inflation is projected to remain at just below 2 per cent in 2025, with services the primary source of upward pressure
Figure 5: Contributions to annual change in headline inflation
Source: CSO and Central Bank of Ireland. Chart data in accessible format. (CSV 0.55KB)
Uncertainty has declined from its spike in April 2025 but remains above historical norms
Figure 6: Standardised measures of uncertainty (number of standard deviations)
Source: Federal Reserve Economic Data (FRED), Rice, J. (2023), Caldara et al. (2019) and Central Bank of Ireland calculations. Chart data in accessible format (CSV 0.53KB)
Forecast Detail
External Environment
Tariff-related uncertainty has recently receded. The assumptions for the international economy underpinning the central projections in this Bulletin have been revised up slightly since June, in particular for 2025. Uncertainty in US trade policy has decreased in recent months, with new US tariff rates on imports from most countries having been decided, either by agreement or unilaterally. While the decrease in uncertainty is a positive development, especially for businesses, and in many cases the eventual tariff rates are lower than those initially announced on ‘liberation day’, this still represents a very large trade shock, bringing the effective US tariff rate to levels not seen in a century. While uncertainty on the rate at which they are set has decreased, uncertainty related to the economic effects of these levies remains elevated, as they have only recently been introduced and their full implications for inflation and growth are yet to be seen.
The global economy appears resilient to date in 2025 but there are significant downside risks to the outlook. So far, US growth has remained relatively strong, net of a first-quarter fall in GDP due to inventory build-up, which was largely reversed in the second quarter. However, some signs have emerged of a weakening in the labour market and an increase in inflation. Growth in China surpassed expectations in the second quarter of 2025, with GDP increasing by 5.2 per cent year on year. This expansion was supported by government stimulus and continued strength in exports, and despite weaknesses in domestic demand. China continues to face deflationary pressures with consumer prices down 0.4 per cent year-on-year in August. For the wider global economy, it is expected that the current tariff levels will lead to a slowdown in growth, but especially in the US and the economies most exposed to the tariffs. These include Canada and Mexico owing to their deep economic integration with the US, India and Brazil (which both face 50 per cent tariffs), and China. The euro area, Japan and the UK concluded agreements with the US for relatively lower tariff rates on most goods (of 15 per cent, 15 per cent and 10 per cent respectively).
Table 2: International Economic Outlook
| | 2024 | 2025f | 2026f | 2027f |
|---|
| World | 3.3 | 2.8 | 3.0 | 3.2 |
| Euro area (September 2025 MPE) | 0.8 | 1.2 | 1.0 | 1.3 |
| US | 2.8 | 1.9 | 2.0 | 2.0 |
| UK | 1.1 | 1.2 | 1.4 | 1.5 |
| Japan | 0.2 | 0.7 | 0.5 | 0.6 |
| China | 5.0 | 4.8 | 4.2 | 4.2 |
| Emerging economies | 4.3 | 4.1 | 4.0 | 4.2 |
| Weighted global demand for Irish exports | 2.3 | 2.4 | 0.8 | 2.7 |
Notes: Table shows projections for annual GDP growth for major global economies. Forecasts for the euro area and for weighted global demand for Irish exports are from the Eurosystem Staff Macroeconomic Projections, September 2025. Forecasts for the remainder are from the IMF WEO Update July 2025 and the April 2025 WEO.
The September Eurosystem staff macroeconomic projections for the euro area foresee GDP growth of 1.2 per cent, 1 per cent and 1.3 per cent in 2025, 2026 and 2027, respectively. The projection for 2025 was revised upwards by 0.3 percentage points compared with the June forecast reflecting better than expected incoming data and a carry-over effect from revisions to historical data. The appreciation of the euro and weaker foreign demand (in part related to somewhat higher tariffs than assumed in the June projections) resulted in a 0.1 percentage point downward revision for 2026. The projection for 2027 was unchanged from June. Over the medium term, euro area economic growth is expected to be supported by rising disposable income, reduced uncertainty, stronger foreign demand and fiscal stimulus related to defence and infrastructure. Euro area headline inflation is expected to stabilise around the medium-term target of 2 per cent, with projections for HICP inflation of 1.7 per cent and 1.9 per cent in 2026 and 2027 respectively. The ECB Governing Council (GC) decided in September to keep the three key ECB interest rates unchanged, with the deposit facility rate standing at 2.0 per cent. The GC considers the risks to economic growth to have become more balanced, and the dynamics of underlying inflation to be consistent with its medium-term target, despite remaining uncertainty and risks on both sides; the GC’s future decisions will continue to be data-dependent. Overall weighted external demand for Irish exports is projected to grow at an annual average rate of 2 per cent from 2025 to 2027, lower than its long-run historical average (Table 2).
Economic Activity
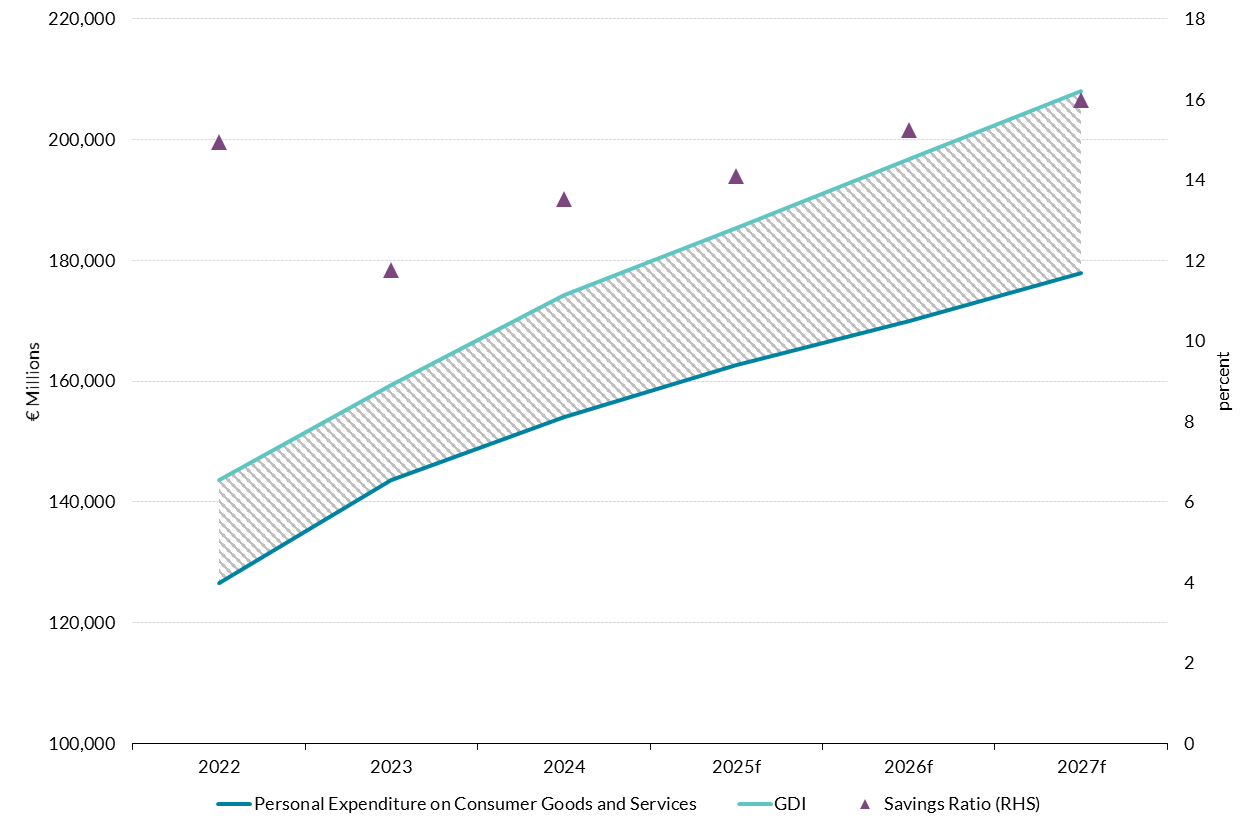
Consumption growth is revised up for 2025 relative to the QB2 forecast (June), as revised CSO data in the interim re-confirms the outlook from QB1, but the pace of growth is projected to slow out to 2027 in line with the forecast for real incomes. Consumption growth for 2025 has been revised upwards since the June forecast by 0.4 percentage points to 2.9 per cent, mostly reflecting a resilient outturn for the first half of 2025. Looking further ahead, consumption growth is forecast to moderate gradually in line with the expected path of real incomes (Figure 7). Annual growth is projected to average 2.1 per cent during 2026 and 2027, primarily reflecting slower employment growth and gains in real incomes. Although the H1 consumption outturn was resilient in the face of elevated uncertainty and weak consumer sentiment, these factors are still expected to weigh on consumption growth over the remainder of the forecast horizon. The projections for consumption along with the expected growth in incomes is consistent with the savings ratio remaining broadly flat over the forecast horizon at an average of 15.1 per cent. This projected rate is above its long-run (1999 to 2024) average of 12.2 per cent as more elevated savings are underpinned by ongoing structural changes, in particular a shift to an older population and higher rates of precautionary saving (see Boyd, Byrne and McIndoe-Calder, 2025 (PDF 1.05MB)).
Consumption grew by 3 per cent in the first half of 2025, a slightly stronger outturn than expected at the time of the last projections in June given observed headwinds. Consumption grew by 0.2 per cent in Q1 on a seasonally adjusted basis with the pace of growth picking up in Q2 to 1 per cent. This positive outturn materialised despite a sharp fall in consumer sentiment and record levels of economic policy uncertainty. Consumption growth in the second half of 2025 is expected to be supported by resilient employment and a supportive fiscal stance. Evidence from the Consumer Expectations Survey suggests that the fraction of households who consider themselves liquidity constrained has fallen quite sharply over the past 12 months, which should support continued increases in consumption while the savings rate remains high.
Consumption projected to rise in line with disposable income as savings rate remains high
Figure 7: Consumption, disposable income and the savings rate (per cent)
Source: CSO and Central Bank of Ireland. Chart data in accessible format (CSV 1.18KB).
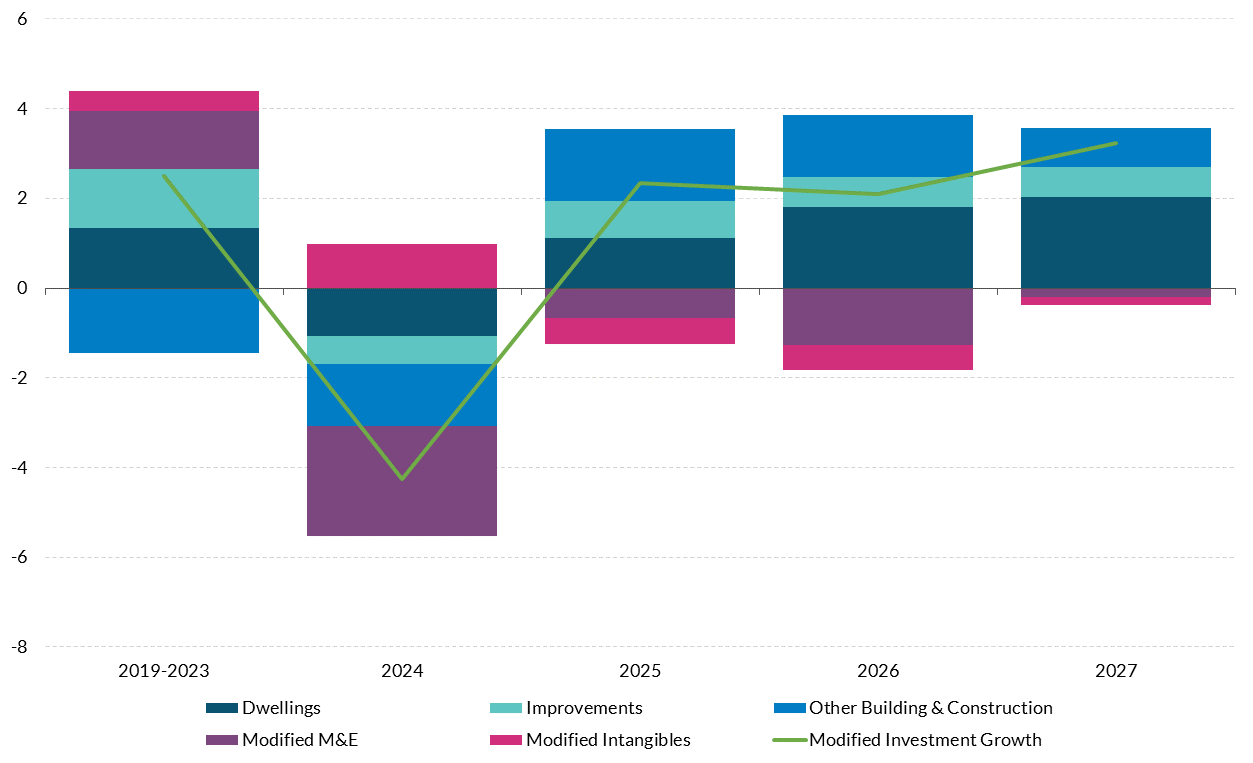
The outlook for domestic investment has been revised up for 2025 but the overall outlook is muted and forecasts are particularly sensitive to the performance of the MNE-dominated parts of the economy. Modified investment is forecast to grow in 2025 by 2.4 per cent, compared to the small decline of 0.6 per cent projected in QB2 (Figure 8). The main reason for the more positive expected outturn in this forecast is revisions to historical investment data published by the CSO in July and more positive high-frequency soft data on investment activity. Revisions to previous data saw the level of modified investment in real terms in 2023 and 2024 revised up by 23 per cent and 15.2 per cent, respectively. Combined with a solid outturn for modified investment in H1, this has prompted an upward revision to the overall forecast for 2025. Modified investment has been revised up marginally in 2026 and 2027 reflecting a combination of factors. The projection for housing completions has been revised downwards for 2026 and 2027 as shortages of critical water and energy infrastructure appear to be a more binding constraint on the number of dwellings that can be delivered in those years. Housing completions are forecast to stand at 32,500, 36,000 and 40,000 in 2025, 2026 and 2027, respectively. Offsetting weaker projected new housing construction, the forecasts for improvements and non-residential building and construction have been revised up modestly across the forecast horizon, largely reflecting more positive new data since the June forecasts. Modified machinery and equipment (around one-fifth of overall modified investment) grew rapidly from 2021 to 2023 – increasing at an annual average rate of 20 per cent. In 2024, despite falling by 10 per cent, it remained 27 per cent above its 2019 level in real terms. This component of investment is dominated by multinationals and, therefore, its future path will be influenced by the evolution of activity in this sector. Reflecting the expected impact of continued high uncertainty and the effect of tariffs on MNE activity, modified machinery and equipment investment is forecast to contract out to 2027. The overall level of investment will remain high by historical standards with the level of modified machinery and equipment investment in 2027 still expected to be 14.4 per cent above its 2019 level.
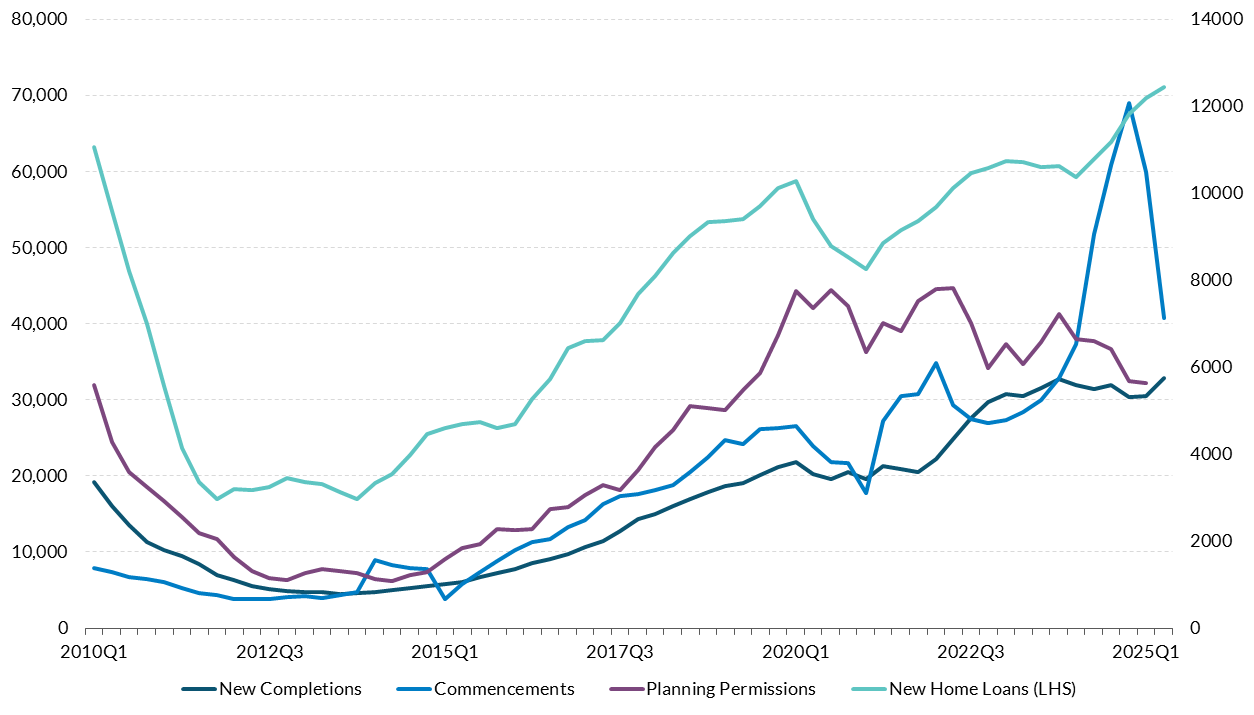
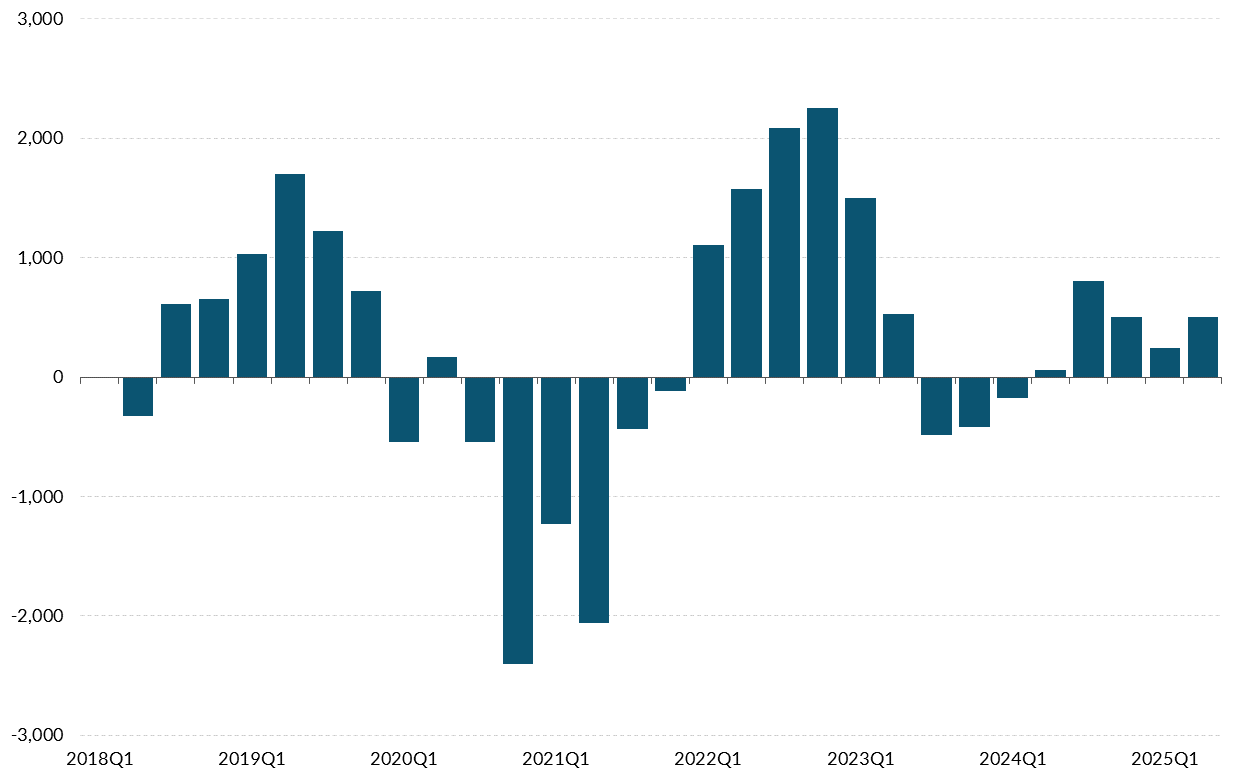
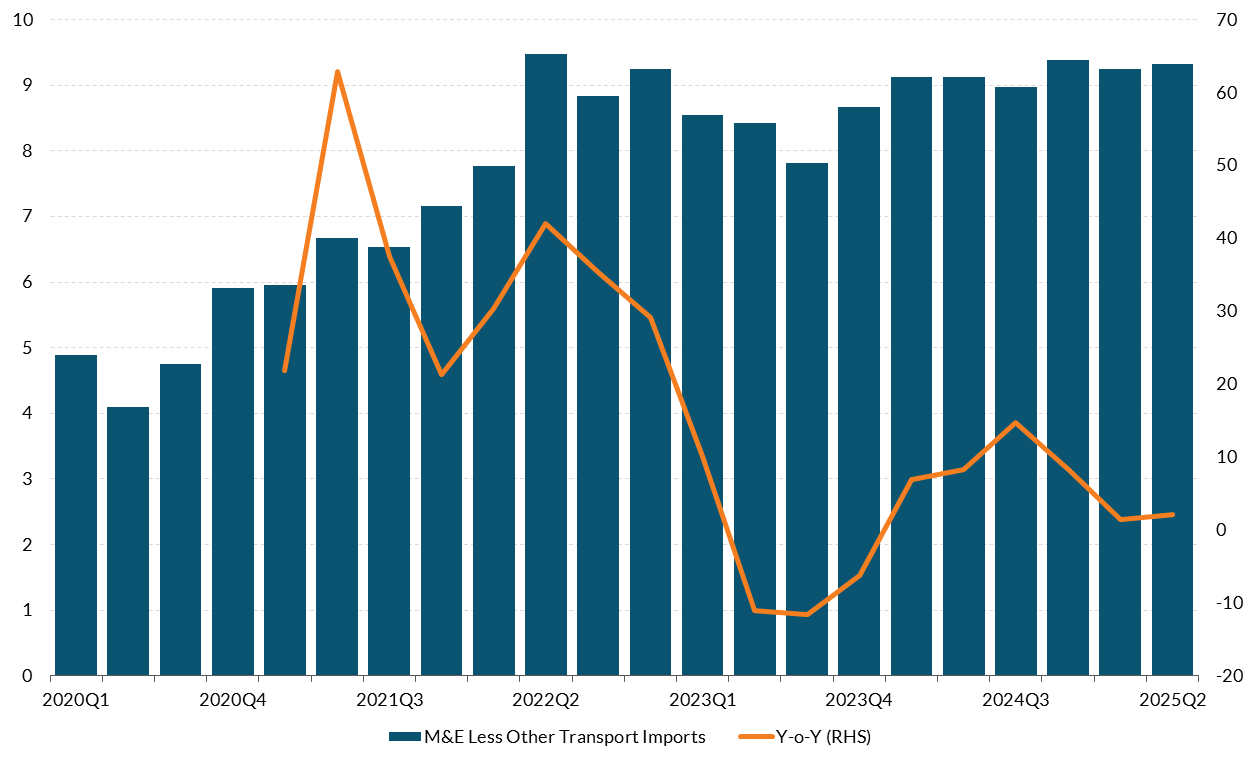
Overall, domestic investment was resilient in the first half of 2025 but housing investment remains subdued and new supply is constrained by shortages of key water and energy infrastructure. National Accounts data for modified investment were revised substantially upwards for Q1 2025 with significant revisions to previous years also occurring with the release of new CSO data in early July. Most of the upward revisions were to improvements, non-residential building and modified intangibles. For housing, dwellings came in at 15,152 new units in H1 2025, slightly above previous expectations. Commencements declined to 6,325 in H1, down from 34,490 in H1 2024. This latter development reflects the largely anticipated effect of the ending of the development levy and Irish Water rebate. The volatility in commencements introduces significant uncertainty to the forecast for housing completions. Permissions and new home loans are not pointing to any substantial acceleration in new supply and the infrastructural barriers around water and electricity connections are constraining new completions (Figure 9). House price to cost ratios, however, are increasing viability in some sectors. Net loan draw-downs by non-financial corporations increased in Q2 2025, from €242 million in Q1 2025 to €502million in Q2 2025 (Figure 10). Of note is that estimated repayments by SMEs, which stood at €1.1 billion in Q1 2025, are high by recent historical standards and could be a signal of a preference by SMEs to repay loans rather than invest given the elevated level of uncertainty. Indicators for non-construction investment point to possible resilience in activity. Imports of machinery and equipment – a reasonable indicator of modified machinery and equipment investment – are on a downward trend and increased by just 2.2 per cent year-on-year in Q2 2025, pointing to weakness in that investment component (Figure 11). The latest PMIs for manufacturing in August also point to an expansion in output and new orders. The services PMI for August points to a more modest expansion in activity, but expectations for future activity are positive. Construction PMIs are less positive. The housing, commercial and civil engineering PMIs for August point to a contraction in activity. The more forward-looking expectations and employment components are more positive, however. On balance, the hard and soft data are consistent with a relatively resilient outturn for domestic investment in the first half of 2025, albeit with signs of weakness in recent soft data on construction activity.
Modified investment growth is forecast to grow but is sensitive to MNE risks
Figure 8: Contributions to modified investment growth (annual, per cent)
Source: CSO and Central Bank of Ireland. Chart data in accessible format (CSV 1.9KB).
House completions remain low as shortages of supporting infrastructure persist
Figure 9: Annualised Units
Source: CSO, DoHLGH, BPFI and Central Bank of Ireland. Chart data in accessible format (CSV 0.66KB).
Moderate levels of net lending to non-financial corporations
Figure 10: Net lending to NFCs, transactions, annualised € million
Source: Central Bank of Ireland. Chart data in accessible format (CSV 2.38KB).
Imports of machinery and equipment have plateaued
Figure 11: Machinery and equipment imports, € billion and year-on-year change
Source: CSO. Chart data in accessible format (CSV 2.34KB).
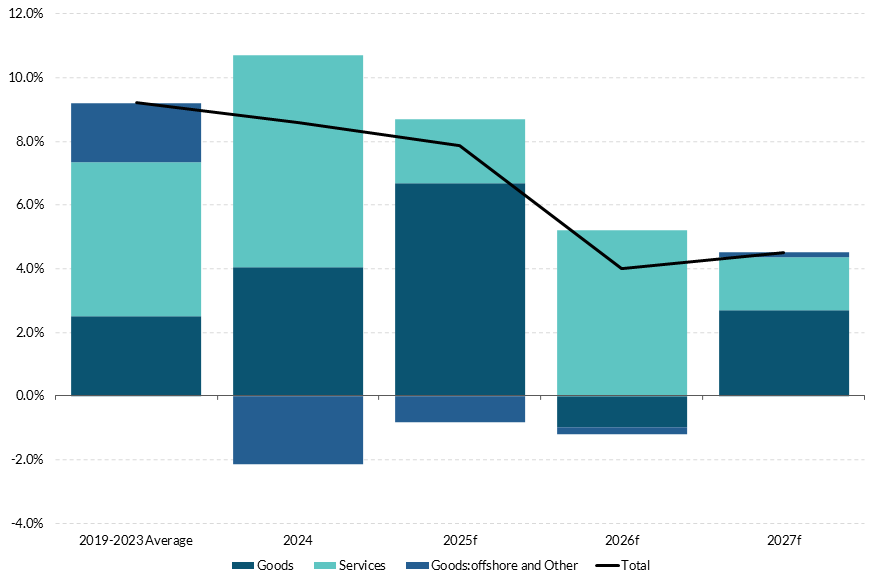
Exports of goods and services are forecast to grow out to 2027 but more slowly than would have occurred in the absence of the higher global tariffs now in effect. The central forecast incorporates the estimated impact of the EU-US trade agreement announced on 27 July and the subsequent joint EU-US Framework Agreement published on 21 August. The EU-US agreement imposes tariffs of 15 per cent on most US imports from the EU. The Agreement states that tariffs on goods subject to section 232 investigations (including pharmaceuticals and semiconductors) will not exceed 15 per cent. The US administration has announced the imposition of high tariffs on several other trading partners including tariffs of 50 per cent on India and Brazil, 39 per cent on Switzerland and 20 per cent on Vietnam and Taiwan. Research by Central Bank staff (Central Bank of Ireland, 2025 (PDF 1.4MB)) presents model-based estimates of the effects of these tariffs on the Irish economy and these estimated impacts have been used to inform the short-term forecasts in the Bulletin. Although the tariffs currently announced are estimated to reduce global trade and external demand for Ireland (relative to a baseline with no tariffs), exports are still forecast to grow out to 2027. Assessing the near-term outlook for goods exports is complicated by the surge in pharmaceutical exports in the first five months of the year, which has shown signs of an unwinding in recent months. The scale and precise timing of this unwinding will impact the forecast for overall export growth for 2025 and to some extent for 2026. Stripping out this near-term volatility, underlying global demand for the main outputs of the pharmaceutical sector (which account for the majority of goods exports) appears strong and should support continued growth in goods exports. Meanwhile, services exports – which are currently not subject to tariffs and have grown by 7.4 per cent on average per annum since 2020 – are forecast to continue to expand. Putting these elements together, overall exports are projected to rise by 4.3 per cent per annum on average in 2026 and 2027 (Figure 12). Imports are projected to grow by 4.8 per cent in 2025, easing to an average of 3.3 per cent in 2026–27, consistent with the path of final demand and ongoing supply chain normalisation.
Pharmaceutical exports, which surged in the first five months of the year, fell back sharply in June. For the first five months of the year, goods exports to the US increased by 153 per cent compared to the same period in 2024. The increase consisted almost entirely of pharmaceutical products, in particular one product category, namely polypeptide hormones (which includes ingredients in drugs to treat diabetes and obesity) (Figure 13). Exports of this product group began to increase sharply from mid-2024 (in advance of front-loading activity) and is driven by a small number of firms, some of which opened new manufacturing capacity in Ireland in recent years. Pharmaceutical exports to the US declined by 23 per cent in June compared to the same month in 2024 and it is possible that further unwinding of the surge in exports observed up to May continues in the coming months. Beyond this near-term volatility, global demand for these products and treatments is currently high which should underpin continued growth in exports over the medium term.
The modified balance of payments position is projected to remain in surplus. The modified current account surplus expanded to 8.2 per cent of GNI* in 2024, higher than expected at the time of the last Quarterly Bulletin. The primary factor driving the surplus was a significant growth in the export of computer and business services. The surplus is expected to remain elevated in 2025, reflecting the projected strong merchandise export growth coupled with a continued contribution from services. In 2026, the surplus is forecast to narrow somewhat as the net trade contribution declines compared with 2025. However, the external position is forecast to remain in surplus, supported by strong multinational activity. While the central outlook for the external balance remains strong, there are significant risks around the forecast (see Balance of Risks).
Strong growth in pharmaceuticals forecast to drive export growth in 2025
Figure 12: Decomposition of overall annual export growth (per cent)
Source: CSO and Central Bank Calculations. Chart data in accessible format (CSV 0.74KB).
Merchandise exports surged in Q1 but declined sharply in June as frontloading activity stalled
Figure 13: Value of merchandise exports, € billion
Source: Eurostat and central bank calculations. (CSV 0.55KB)Chart data in accessible format. (CSV 6.54KB)
Inflation
The central projection is for headline inflation to moderate further and to remain below 2 per cent. Headline inflation is projected to stand at 1.8 per cent in 2025, before declining to 1.4 per cent for both 2026 and 2027 (Table 3). The downward revisions to these inflation forecasts since the last Bulletin mainly reflect the impact of lower energy prices, an appreciation of the euro and weaker services inflation. Food price inflation is projected to remain broadly unchanged relative to the QB2 projections. While certain food products have experienced price increases recently (see Box A), there has not been a broadly based rise in food prices. Technical assumptions point to a moderation in food commodity prices over the forecast horizon, while a stronger euro is expected to exert downward pressure on this component of inflation, particularly on processed food price inflation. Reflecting continued projected growth in domestic demand and persistent supply constraints, services inflation is expected to average 2.7 per cent out to 2027 – well above the headline rate – and will be the main contributor to overall inflation over this period.
Key assumptions underlying the forecast remain broadly unchanged from the last Bulletin. Energy price assumptions underpinning the forecasts remain largely unchanged compared to the last Bulletin, although assumptions concerning the level of oil prices have been revised upward, by 4.5 per cent in 2025 and by lower rates in the following two years. Electricity and natural gas assumptions remain broadly in line with QB2 (June 2025). The euro exchange rate against the USD has been revised upward, from 1.13 to 1.16 for the second half of 2025, indicating an appreciation of the euro over the year. The euro is also assumed to be slightly stronger against the GBP than at the time of QB2 (from 0.85 to 0.87).
Table 3: Inflation Projections
| | 2024 | 2025 | 2026 | 2027 |
|---|
| HICP | 1.3 | 1.8 | 1.4 | 1.4 |
| Goods | -1.5 | 0.7 | 0.0 | 0.0 |
| Energy | -7.8 | -0.5 | 0.9 | 1.4 |
| Food | 3.0 | 3.6 | 1.5 | 1.3 |
| Non-Energy Industrial Goods | -1.9 | -0.8 | -1.4 | -1.6 |
| Services | 4.1 | 2.8 | 2.6 | 2.7 |
| HICP ex Energy | 2.4 | 2.1 | 1.4 | 1.4 |
| HICP ex Food & Energy (Core) | 2.3 | 1.8 | 1.4 | 1.4 |
Source: CSO, Central Bank of Ireland
Underlying inflation has declined marginally over the past year. Most measures of underlying inflation now lie below 2 per cent (Figure 14). Year-on-year headline inflation of 1.8 per cent was recorded in August 2025, following a 1.6 per cent outturn for July. The slowdown in this measure of inflation up to July is largely explained by a moderation in services inflation and subdued energy prices. Initial signs of a further easing in services inflation have emerged of late, with recent decreases largely attributable to lower air fares within the transport category (Figure 15). The share of goods and services experiencing price increases of 5 per cent or higher has decreased sharply over recent months, standing at 11 per cent in July compared to 63 per cent a year earlier. Irish consumers' expected rate of inflation remains high but has been slowly decreasing since April 2025. In July 2025, median expectations for inflation over the next year among Irish consumers stood at 3 per cent. The equivalent figure for the euro area was 2.6 per cent. There is some evidence that housing market dynamics can exert an influence on consumers' inflation expectations (see Box B).
Measures of underlying inflation have held close to 2 per cent
Figure 14: underlying inflation measures, year-on-year per cent change (%)
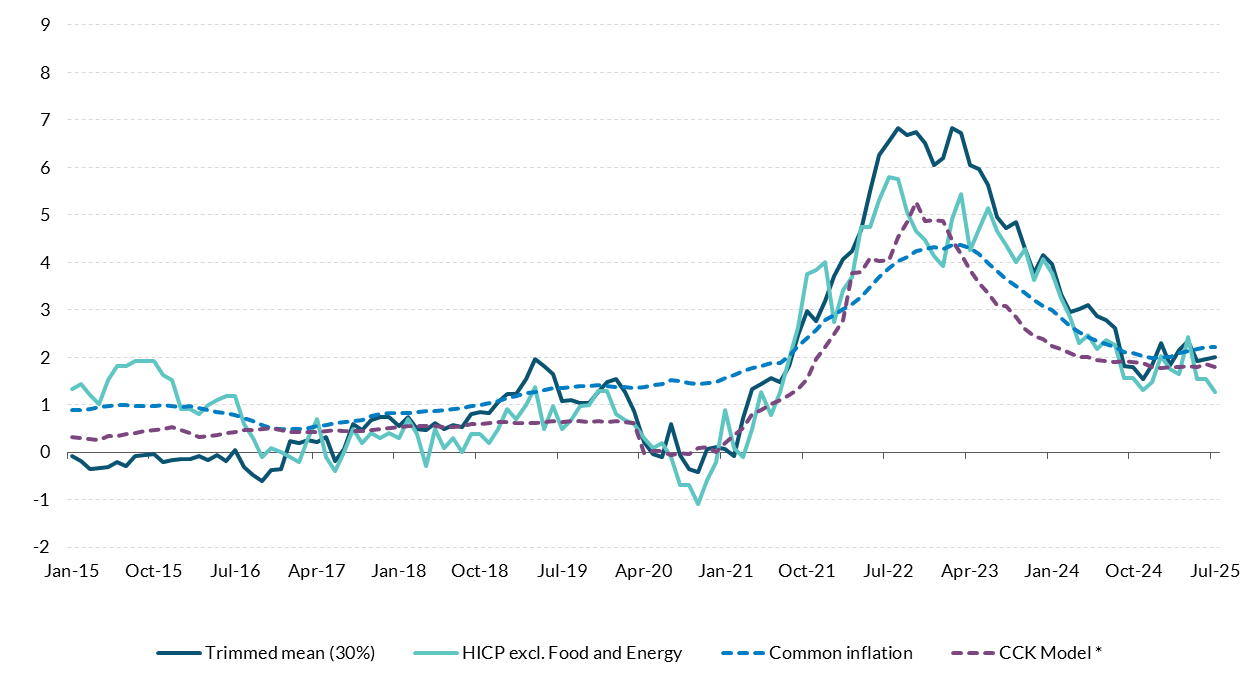
Source: Eurostat, Central Bank of Ireland calculations. Chart data in accessible format (CSV 4.09KB).Notes: Chan, Clark and Koop (CCK) Model - we follow Chan et al (2018). A new model of inflation, trend inflation, and long‐run inflation expectations.
Declines in transport prices have exerted downward pressure on services price inflation
Figure 15: year-on-year per cent change
Source: CSO and Central Bank of Ireland calculations. Chart data in accessible format (CSV 0.26KB).
Labour Market and Earnings
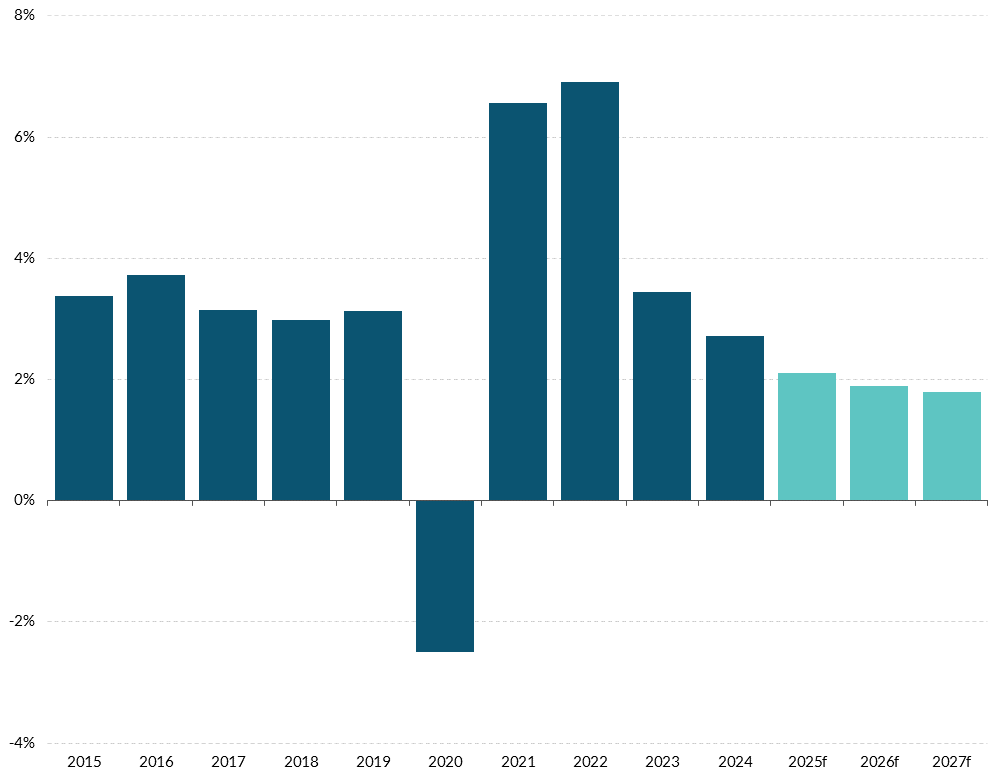
The labour market remains in a relatively healthy condition despite heightened economic uncertainty and geopolitical tensions. Labour market projections are relatively unchanged from QB2, with employment growth forecast to slow from 2.7 per cent in 2024 to 2.1 per cent in 2025 (Figure 16 and Table 4). Growth is expected to moderate further over the forecast horizon as elevated business uncertainty contributes to lower levels of job creation. The continued reliance on net inward migration to underpin employment growth faces challenges from ongoing infrastructural constraints.
Employment growth is projected to ease over the forecast horizon
Figure 16: Employment growth, annual change, per cent
Source: CSO. Chart data in accessible format (CSV 1.31KB).
Notes: Chart shows the average annual growth rate of employment between 2015 and 2027.
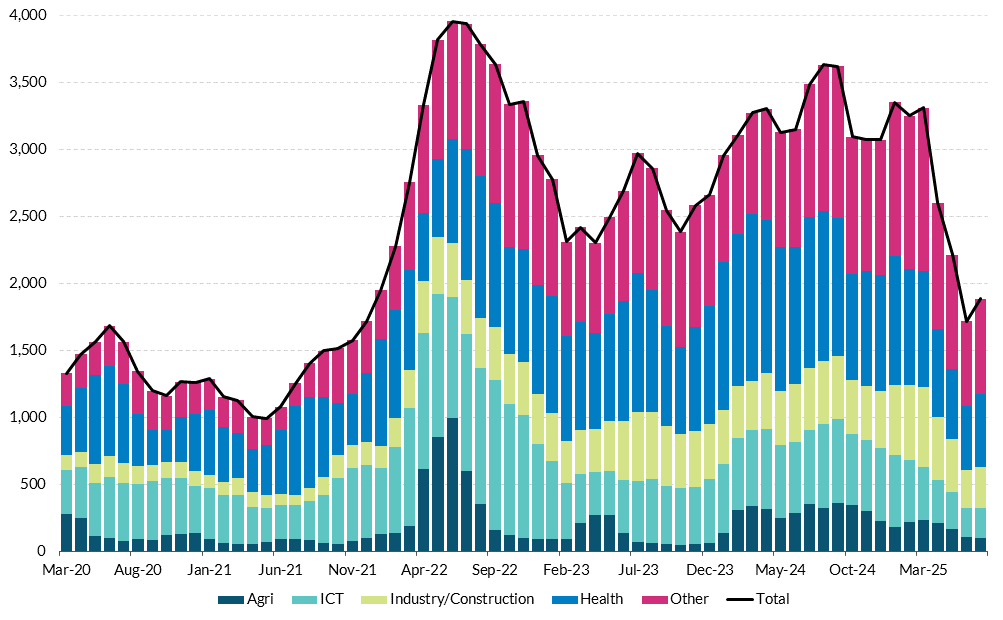
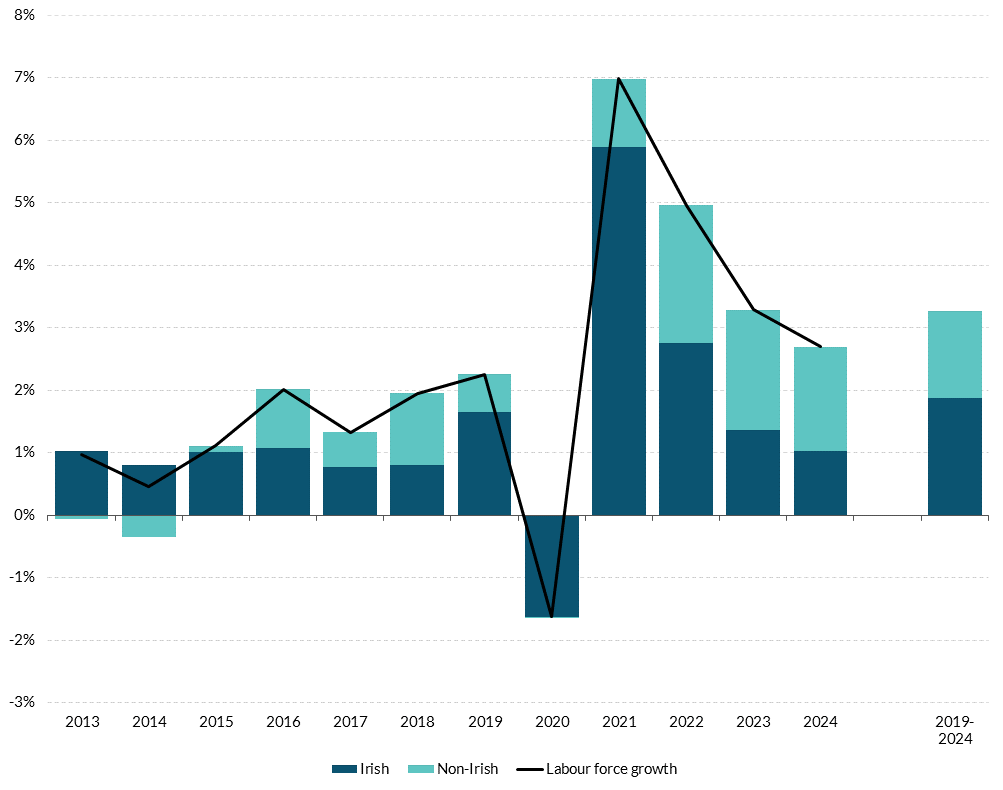
Employment reached a new record high in Q2 2025, although net inward migration declined in the year to April. Employment increased year-on-year in Q2 2025 by 2.3 per cent (+63,900) and now exceeds 2.8 million persons for the first time. Employment in the construction sector increased by 18.4 per cent (+29,600) in Q2 2025 and accounted for 46 per cent of total employment growth. This represents the highest level of construction employment since Q3 2008 but some caution is warranted in interpreting quarterly changes in employment at a sectoral level. Employment permits have declined in recent months with data for the year to July 2025 recording an 18 per cent decline relative to 2024 figures (Figure 17). Even though permit levels are approximately double the pre-pandemic average, this moderation may curb the future pace of labour force growth as higher inflows of non-Irish citizens has accounted for close to half of the overall annual average growth in the labour force since 2019 (Figure 18). CSO population and migration estimates for the year to April 2025 point to a 25 per cent decline in net inward migration, though levels remain relatively high by historical standards at 59,700. Non-Irish citizens accounted for 49pp of the overall growth in the labour force in the year to Q2 2025 and now account for 21 per cent of aggregate levels, up from 14.4 per cent in 2015. Over the forecast horizon, net inward migration is expected to converge towards its long-run average, which alongside a slowing rate of natural increase, may constrain employment growth.
Employment permits experienced a notable decline in Q2 2025
Figure 17: Employment permits (levels)
Source: Department of Enterprise, Tourism and Employment. Chart data in accessible format. (CSV 3.21KB)
Labour supply has been boosted by net inward migration
Figure 18: Contributions to growth in the labour force, per cent
Source: CSO, Labour Force Survey. Chart data in accessible format (CSV 1.02KB).
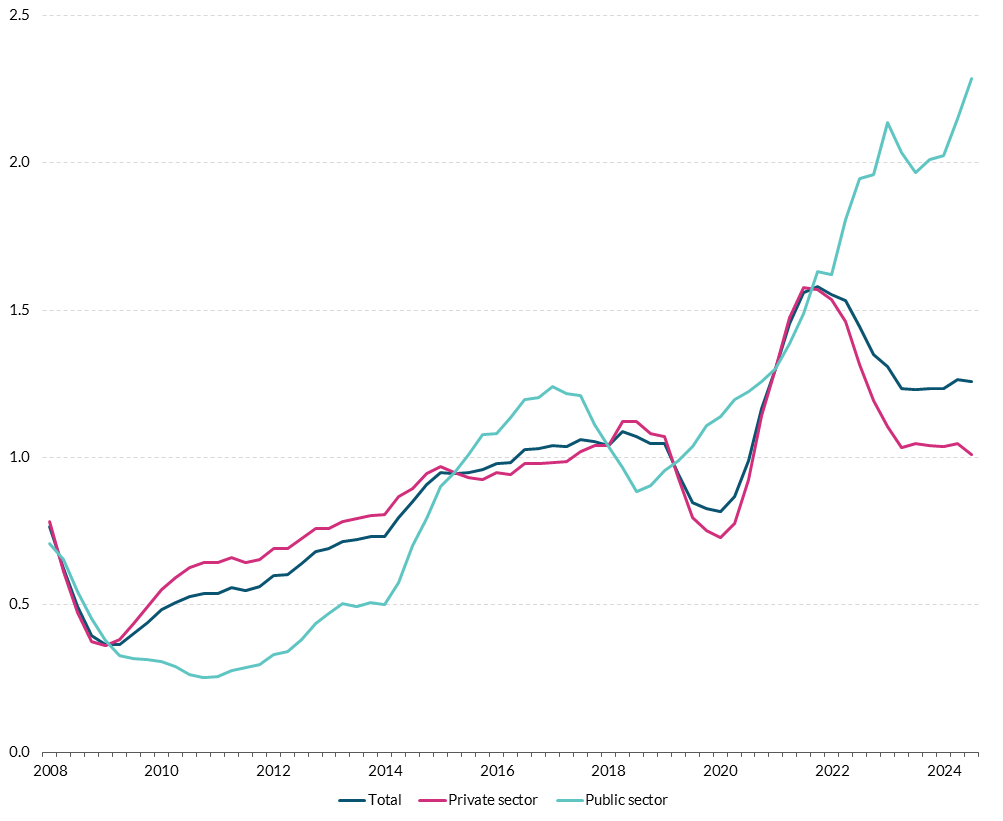
Unemployment has increased slightly driven by younger age groups, with slowing labour demand expected to bring the unemployment rate close to 5 per cent. The unemployment rate increased to 4.8 per cent (140,800 persons) in Q2 2025, up from 4.3 per cent in Q1 2025 and 4.6 per cent in Q2 2024. The recent increase is mainly driven by persons aged 15-19 years, accounting for just below three-quarters of the rise in the level of unemployment in Q2. As this group has relatively high transition rates into and out of the labour force, seasonal flows may curb further unemployment growth in 2025 as a proportion of the group return to education in the second half of the year. There has been a rise in the labour under-utilisation rate to 13.4 per cent in recent quarters (the sum of unemployment, part-time underemployment and the potential additional labour force), with figures now at their highest since Q4 2021. This is mainly owing to those in part-time underemployment, a cohort of persons in part-time employment who wish to work more hours. Labour demand continues to moderate, as indicated by Indeed job postings with data for July 2025 showing a 7.8 per cent year-on-year decrease. The EHECS job vacancy rate remains relatively stable at 1.3 per cent, although increased vacancies are driven entirely by the public sector as the private sector vacancy rate continues to moderate and is at its lowest level since Q2 2021 (Figure 19). Looking ahead, a slower rate of job creation is expected to have a negative effect on those attempting to enter the labour market from inactivity, mainly younger age cohorts. A gradual increase in average annual unemployment to 4.9 per cent in 2027 is expected as business caution regarding investment and a slower projected pace of economic activity contributes to reduced labour demand (Table 4).
Public sector vacancies have sustained the aggregate vacancy rate while private sector slows
Figure 19: Job vacancy rate, per cent
Source: CSO, EHCS. Chart data in accessible format (CSV 0.73KB).
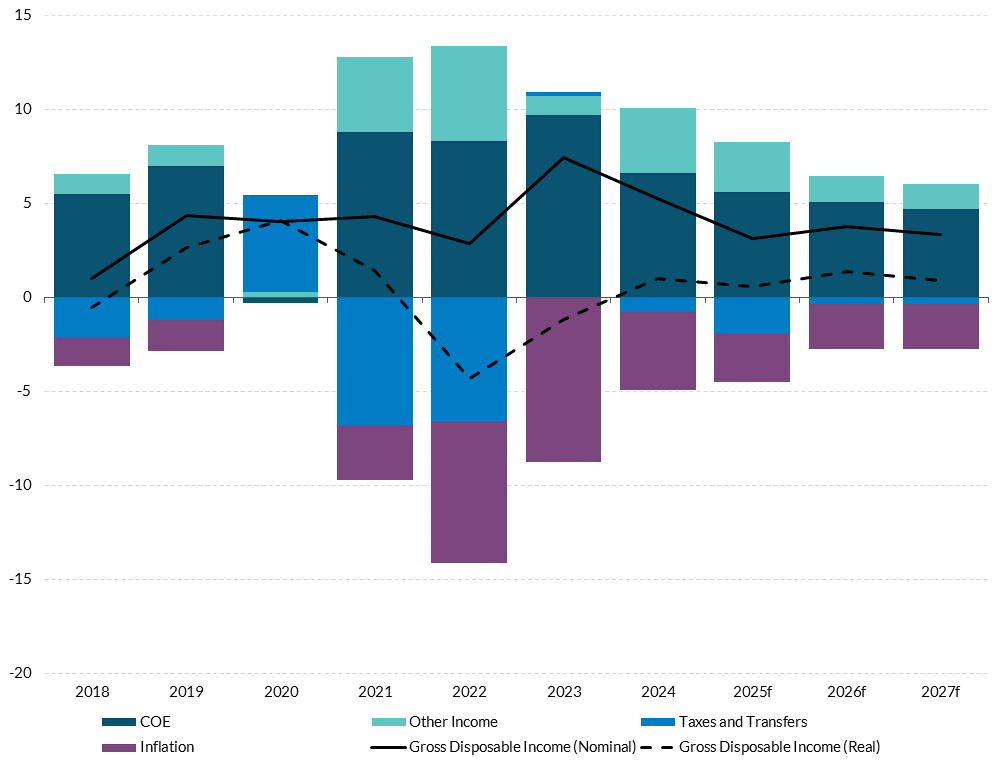
Real wages are forecast to grow over the forecast horizon. Positive real wage growth was recorded in 2024 following two years of declines. Revisions contained in the Annual National Accounts data published in July 2025 saw compensation per employee rise by 0.1 per cent in real terms annually in 2024, the first positive real increase since 2021. The nominal increase was 4.2 per cent, down from 6.8 per cent in 2023. Data from Indeed indicate that year-on-year growth in posted wages has slowed to 3.8 per cent in July, down from a 4.3 per cent average in the first half of the year. The level of job postings continues to moderate steadily, with levels in July down year-on-year by 7.8 per cent. Average nominal wage growth of 3.8 per cent is projected out to 2027 as labour demand is forecast to ease. Combined with lower inflation, this is expected to result in real wages growing by an average of 1.3 per cent over the forecast horizon. Gross Disposable Income per household increased by 5.3 per cent in nominal terms in 2024. This equates to a 1 per cent increase in real terms (Figure 20). The increase in real income at the household level is expected to support consumption growth as the level of government transfers from once-off expenditure items is reduced in Budget 2026.
Real household incomes increased in 2024 following two years of decline
Figure 20: Decomposition of disposable income, annual growth rate, per cent
Source: CSO and Central Bank of Ireland calculations.Chart data in accessible format (CSV 0.51KB).
Table 4: Labour Market Forecasts
| | 2023 | 2024 | 2025f | 2026f | 2027f |
|---|
| Employment (000s) | 2,685 | 2,757 | 2,817 | 2,871 | 2,922 |
| % change | 3.4% | 2.7% | 2.1% | 1.9% | 1.8% |
| Labour Force (000s) | 2,805 | 2,880 | 2,953 | 3,015 | 3,073 |
| % change | 3.3% | 2.7% | 2.5% | 2.1% | 1.9% |
| Participation Rate (% of Working Age Population | 65.5% | 65.8% | 66.1% | 66.2% | 66.2% |
| Unemployment (000s) | 120 | 123 | 136 | 144 | 151 |
| Unemployment (% of Labour Force) | 4.3% | 4.3% | 4.6% | 4.8% | 4.9% |
Public Finances
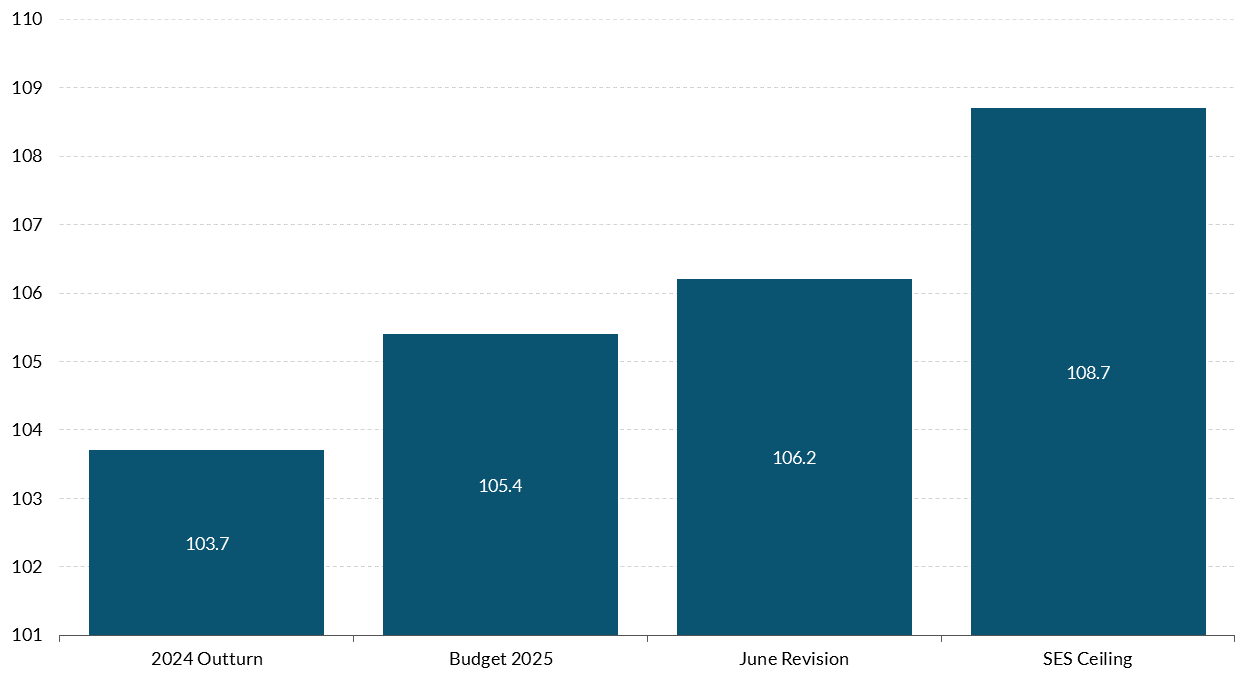
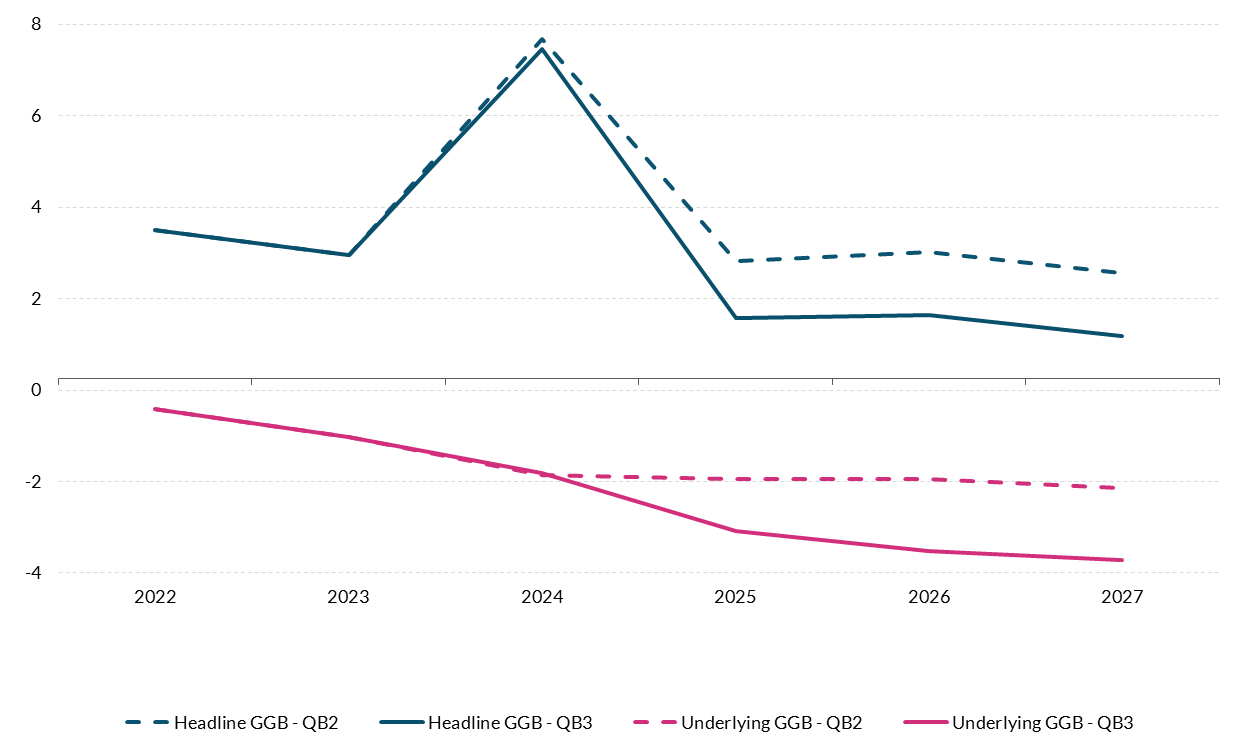
The underlying budget deficit is now projected to be larger out to 2027 when compared with Quarterly Bulletin 2, reflecting additional expenditure measures announced by Government. The underlying general government balance (GGB) is estimated to have recorded a deficit of -2.1 per cent of GNI* in 2024 (Table 5). Latest Exchequer data show growth in income tax and VAT, while remaining robust, has moderated in the first eight months of 2025, while cumulative corporation tax (CT) receipts are only marginally above the level for the same period last year (excluding receipts linked to the Apple State aid case). Gross voted expenditure has recorded strong growth so far this year, and the expenditure ceiling for 2025 has been revised upwards reflecting additional current and capital spending (Figure 21). As a result, the outlook for government expenditure growth for 2025 has been revised sharply upwards and an underlying deficit of -3.3 per cent is now anticipated for this year. This projection assumes no further cost of living supports, similar to the packages included in recent budgets, are provided in the forthcoming Budget.
Table 5: Key Fiscal Indicators, 2023-2027
| | 2023 | 2024(e) | 2025(f) | 2026(f) | 2027(f) |
|---|
| GG Balance (€bn) | 7.9 | 23.2 | 4.4 | 6.5 | 4.5 |
| GG Balance (% GNI*) | 2.7 | 7.2 | 1.3 | 1.8 | 1.2 |
| GG Balance (% GDP) | 1.5 | 4.1 | 0.7 | 0.9 | 0.6 |
| GG Debt (€bn) | 220.7 | 218.2 | 214.5 | 218.0 | 225.9 |
| GG Debt (% GNI*) | 75.7 | 67.9 | 63.6 | 61.3 | 60.2 |
| GG Debt (% GDP) | 42.1 | 38.8 | 33.4 | 31.2 | 30.3 |
| Excess CT (€bn) | 11.6 | 15.7 | 15.7 | 18.4 | 18.4 |
| Underlying GGB (€bn) | -3.7 | -6.6 | -11.2 | -11.9 | -13.9 |
| Underlying GGB (% GNI*) | -1.3 | -2.1 | -3.3 | -3.4 | -3.7 |
Source: Central Bank of Ireland Projections
Note: Underlying GGB excludes estimates of excess CT and receipts from the Apple state aid case; (e) is estimate and (f) is forecast
Over the coming years, spending growth is expected to remain elevated, particularly capital spending, supported by additional planned outlays included in the revised National Development Plan (NDP). For the period 2026 to 2030, planned Exchequer capital funding has been revised upwards by €25.7bn when compared to the previous iteration of the NDP and, as a result, annual growth in nominal capital expenditure is now forecast to average 17 per cent per annum over the projection horizon. Underlying revenue growth, by comparison, is expected to moderate somewhat, reflecting slower growth in domestic activity and employment. As a result, the underlying GGB is projected to deteriorate further to -3.7 per cent of GNI* by 2027. This is a notably less favourable outlook than that in Quarterly Bulletin 2 (Figure 22). Excess CT receipts are forecast to increase to €18.4bn next year, supported by the introduction of the Minimum Tax Directive, which it is estimated will boost total CT receipts by €4.9bn from 2026 onwards. There are significant downside risks to the projection for CT, outlined in the Balance of Risks below. The headline GGB surplus is expected to moderate to 1.2 per cent of GNI* by the end of the projection horizon.
Exchequer gross voted expenditure for 2025 was revised upwards in the Summer Economic Statement
Figure 21: Gross voted expenditure, € billion
Source: Department of Finance. Chart data in accessible format (CSV 0.76KB).
Outlook for underlying GGB has deteriorated
Figure 22: GGB, per cent of GNI*
Source: CSO, Central Bank of Ireland. Chart data in accessible format (CSV 0.41KB).
Notes: Underlying GGB excludes Central Bank estimates of excess corporation tax receipts and receipts from Apple State aid case; CJEU is Court of Justice of EU ruling on Apple state aid case.
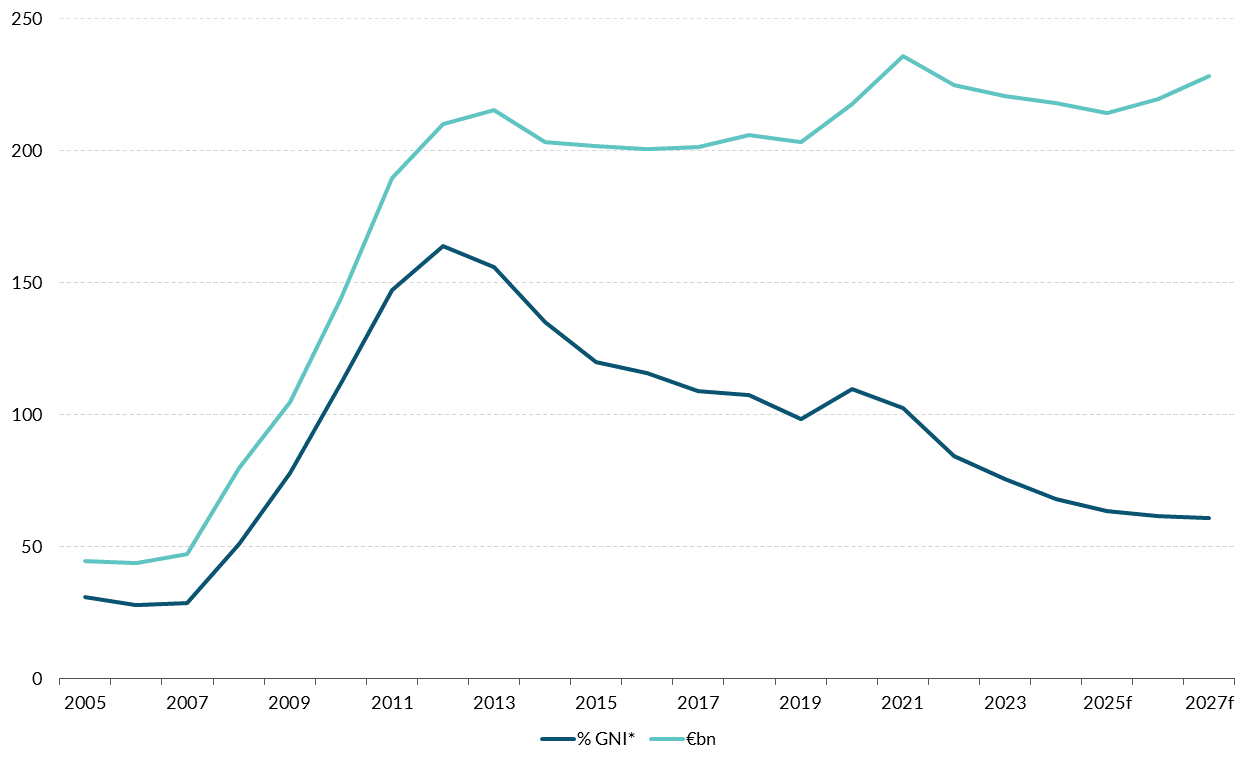
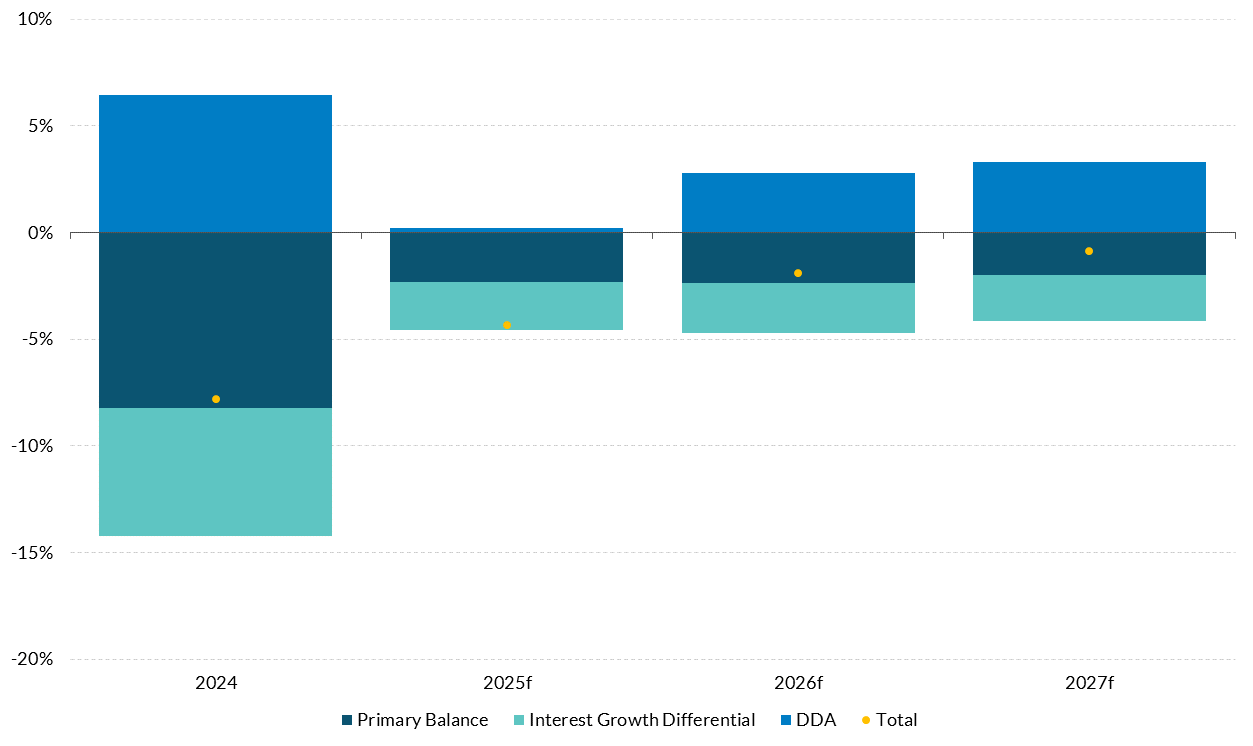
The General Government debt (GGD)-to-GNI* ratio is expected to continue to decline in the years ahead. The GGD ratio is projected to fall to just above 60 per cent by 2027 (Figure 23). The expected improvement is driven by a combination of persistent primary surpluses (averaging 2.2 per cent of GNI* over 2025-2027) and a continuing favourable interest-growth differential (Figure 24). Nominal GNI* growth is expected to average 5.4 per cent per annum over the period 2025-2027, well above the projected average effective interest rate on government debt of 1.7 per cent. The National Treasury Management Agency (NTMA) plans to issue between €6bn and €10bn in bonds this year. The current value of total issuances for the year so far is €5.25bn, with the next bond auction scheduled for mid-September. Cash balances are currently high but are expected to fall by over a quarter to approximately €26bn by end-2025.
Debt ratio is projected to fall to around 60 per cent by 2027
Figure 23: Gross General Government debt, per cent of GNI* and € billion
Source: CSO, Central Bank of Ireland. Chart data in accessible format (CSV 0.12KB).
Budget surpluses and strong nominal growth continue to drive the reduction in the public debt ratio
Figure 24: Decomposition of change in the debt-to-GNI* ratio, per cent of GNI*
Source: Central Bank of Ireland. Chart data in accessible format (CSV 0.12KB).
Notes: DDA is deficit-debt adjustment
Balance of Risks to the Outlook
The threat of a further escalation of global trade tensions persists and means that risks to the current forecasts for economic growth are tilted to the downside. The announcement of an EU-US agreement on tariffs of 15 per cent on 28 July resolved some of the uncertainty present at the time of the QB 2 (June 2025) forecasts. Nevertheless, as outlined in new research (Central Bank of Ireland, 2025 (PDF 1.4MB)), Ireland’s strong trade and FDI linkages with the US make it particularly exposed to US-EU economic tensions. While current EU-US tariffs are unlikely to prompt any material loss of existing FDI from Ireland in the near term, the most significant medium-term risk to Irish economic activity relates to a potential loss in Ireland’s attractiveness for further investment as an export platform for MNEs. This could occur as a result of further changes in US trade, industrial or tax policy and would significantly reduce exports, employment and tax revenue in Ireland relative to the forecasts in this Bulletin. In the event of higher tariffs or other changes resulting in a further fragmentation of global trade, economic growth in the euro area and Ireland’s other key trading partners would be reduced relative to current forecasts. This would spill over to Ireland in the form of even weaker external demand for Irish exports and lower economic activity. Scenario analysis presented by Central Bank staff shows the estimated impact of specific additional tariffs on pharmaceutical exports from Ireland, higher than those underpinning the central forecast (Central Bank of Ireland, 2025 (PDF 1.4MB)). The results indicate that exports and domestic economic activity would be significantly reduced relative to the forecasts in this Bulletin if such higher tariffs materialised.
Delays in alleviating key infrastructural deficits in water, energy and housing would worsen capacity constraints that are already having a negative impact on economic activity, further limiting the growth potential of the economy and possibly putting upward pressure on inflation. The pace of growth in the population, employment and economic activity for at least the last ten years has increased the demand for key infrastructure in housing, energy, water and waste water, and transport. Public and private investment in these areas has increased, and further additional spending is planned, but to date the increase in the provision of new infrastructure still lags behind demand. With the labour market expected to stay near full employment and central forecasts pointing to moderate economic growth, a failure to address infrastructure constraints in a timely manner could worsen the imbalance between domestic demand and supply. Over a prolonged period, insufficient growth in the capital stock of key infrastructural assets in the economy will lower its potential growth rate and could also have negative spillovers to the labour market. Recent growth in the population and in employment has been boosted by high levels of net inward migration and this source of labour supply will become increasingly important in the years ahead as the natural increase in the population (births minus deaths) is expected to decline sharply. If infrastructure bottlenecks persist, this could discourage inward migration, reducing labour supply and further denting the economy’s potential growth rate. Persistent capacity constraints also present an upside risk to inflation that could worsen Ireland’s competitiveness, dampening exports and overall growth in the medium run.
Risks to the public finances are firmly to the downside owing to the vulnerability of government revenue to a loss of corporation tax and the pattern of persistent overruns in public expenditure. Corporation tax revenue (CT) has increased fourfold since 2015 and accounted for one third of Exchequer tax revenue in 2024. CT is highly concentrated with fewer than 10 foreign-owned multinational groups accounting for half of all revenue. Moreover, a large proportion of current revenue – estimated at around 50 per cent of current CT – is considered “excess” – that is those receipts are not linked to underlying activity in the Irish economy. These characteristics mean that the downside risks to continued revenue growth from this tax revenue source are especially pronounced. A further worsening of geoeconomic fragmentation, higher tariffs or other economic or tax policy changes in the US could reduce government revenue from this historically volatile source. Geopolitical developments have also increased the uncertainty surrounding the impact that the Minimum Tax Directive – which operationalises BEPS Pillar II reforms – could have on the government finances. While the forecasts assume that these reforms will have a positive impact on CT revenue from 2026 onwards, both the headline and the underlying budgetary positions would be considerably weaker if existing international tax policy agreements were revisited. On the expenditure side, a pattern of persistent expenditure overruns relative to initial Budget day allocations has become established on a yearly basis in the absence of any effective anchor or rule for fiscal policy. These overruns have averaged €6 billion per annum in the three years to 2024. Persistent spending overruns present a risk to the sustainability of the public finances and to long-run economic growth. For the public finances, the failure to manage public expenditure within initial budgetary ceilings contributes to a larger underlying budget deficit than would be recorded if expenditure growth were managed in line with initial plans. A rising underlying deficit, as has materialised in recent years, leaves the public finances exposed should corporation tax revenues, or any other revenue source, decline. In 2021, the then-Government proposed a rule that would see government spending growth linked to the estimated sustainable growth rate of the economy. If complied with, such a rule would have helped to avoid repeated upward adjustments to expenditure and an overly expansionary fiscal stance during times of strong economic growth, such as has been observed in recent years. However, spending growth has exceeded what the rule implied as an appropriate ceiling in each year since it was announced and it appears to have been effectively discontinued. In the absence of this anchor, there is a risk that the pattern of expenditure overruns relative to budgetary plans will continue, aggravating risks to the public finances and to sustainable economic growth over the medium term.
There is an upside risk to the forecast if economic uncertainty dissipates more quickly or its impact is less than estimated in the central forecast. To date, economic growth in Ireland has proved resilient in the first half of 2025 in spite of a high level of measured uncertainty. The latter is still assumed to weigh on economic growth in the central forecast but if uncertainty declines more quickly than assumed, or if its effect on economic activity is more muted than expected, then this would modestly raise the projections for economic growth above the central forecast.
Risks to the inflation outlook are assessed to be broadly balanced. The central forecast envisages headline inflation remaining stable at below 2 per cent out to 2027. This forecast is sensitive to future changes in international trade policy, as discussed above. Higher tariffs and increased fragmentation in global supply chains could put upward pressure on import prices and domestic inflation. Pushing in the opposite direction, if global economic growth is slower than expected based on current forecasts, this would reduce demand and exert downward pressure on commodity prices. Global commodity price assumptions covering the horizon of the forecasts are broadly unchanged since June; however, elevated geopolitical tensions pose a risk that energy and other key commodities such as food prices, could rise above the path envisaged in current assumptions. This represents an upside risk to the inflation projections in this Bulletin.
Detailed Forecast Table
Table 7: Baseline Macroeconomic Projections for the Irish Economy
| | 2023 | 2024 | 2025f | 2026f | 2027f |
|---|
Constant Prices | | | | | |
| Modified Domestic Demand | 6.1 | 1.8 | 2.9 | 2.2 | 2.4 |
| Modified Gross National Income (GNI*) | 5.7 | 4.8 | 2.6 | 2.2 | 2.7 |
| Gross Domestic Product | -2.5 | 2.6 | 10.1 | 3.8 | 4.2 |
| Final Consumer Expenditure | 4.4 | 3.0 | 2.9 | 2.1 | 2.2 |
| Public Consumption | 6.4 | 4.8 | 3.4 | 2.5 | 2.1 |
| Gross Fixed Capital Formation | 13.4 | -28.5 | 26.9 | 1.6 | 2.2 |
| Modified Gross Fixed Capital Formation | 10.2 | -4.2 | 2.4 | 2.1 | 3.2 |
| Exports of Goods and Services | -3.9 | 8.6 | 7.7 | 4 | 4.5 |
| Imports of Goods and Services | 2.2 | 2.7 | 4.8 | 3 | 3.5 |
| Total Employment | 3.4 | 2.7 | 2.1 | 1.9 | 1.8 |
| Unemployment Rate | 4.3 | 4.3 | 4.6 | 4.8 | 4.9 |
| Harmonised Index of Consumer Prices (HICP) | 5.2 | 1.3 | 1.8 | 1.4 | 1.4 |
| HICP Excluding Food and Energy (Core HICP) | 4.4 | 2.3 | 1.8 | 1.4 | 1.4 |
| Compensation per Employee | 6.8 | 4.3 | 4.1 | 3.7 | 3.6 |
| General Government Balance (% GNI*) | 2.7 | 7.2 | 1.3 | 1.8 | 1.2 |
| ‘Underlying’ General Government Balance (% GNI*)[12] | -1.3 | -2.1 | -3.3 | -3.4 | -3.7 |
| General Government Gross Debt (%GNI*) | 75.7 | 67.9 | 63.6 | 61.3 | 60.2 |
| Modified Investment (share of Nominal GNI*) | 21.2 | 18.4 | 17.9 | 17.4 | 17.0 |
Revisions from previous Quarterly Bulletin, p.p | | | | | |
| Modified Domestic Demand | 3.5 | -0.9 | 0.9 | 0.1 | 0.2 |
| Gross Domestic Product | 3 | 1.4 | 0.4 | 1.2 | -1.4 |
| HICP | 0 | 0 | -0.1 | -0.4 | -0.3 |
| Core HICP | 0 | 0 | -0.1 | -0.4 | -0.3 |
Box A: Insights into recent increases in food prices in Ireland
by Katie Bourke and Gabriel Arce Alfaro
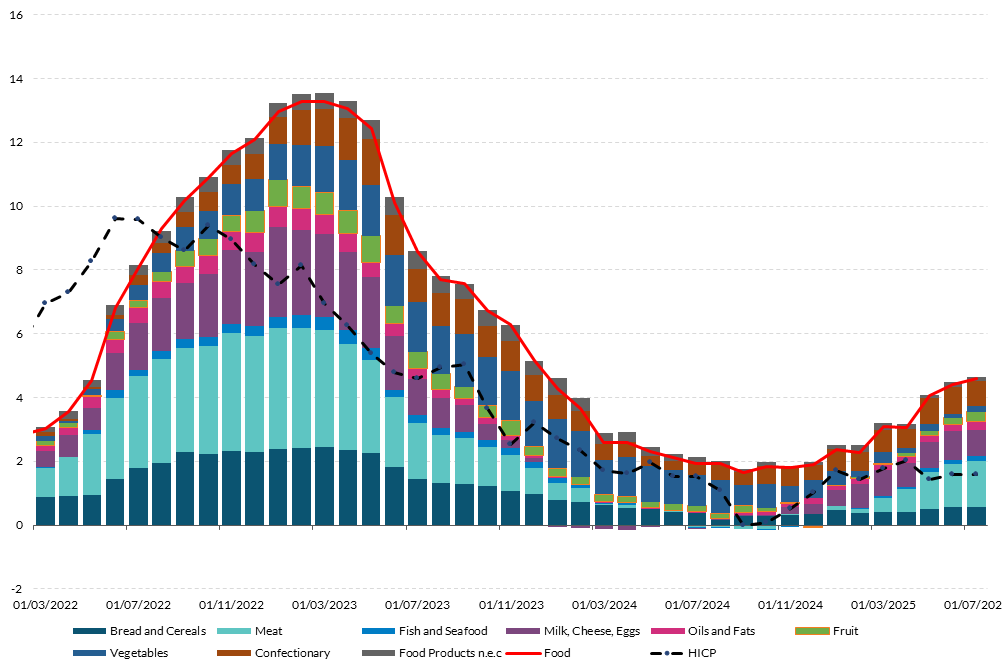
Recent data on Irish inflation indicate broadly stable prices arising in the first half of 2025, with a year-on-year headline inflation rate of 1.6 per cent in July. However, food prices have risen significantly, recording a 4.2 per cent increase—more than double the headline rate (Figure 1). Food inflation accounted for over 40 per cent of July’s overall price change, driven primarily by a few key products, particularly meat. This analysis explores the factors behind these increases.
Meat accounts for the largest share of food inflation in recent months
Figure 1: Food inflation decomposition
Source: CSO data and Central Bank of Ireland calculations. Chart data in accessible format. (CSV 6.15KB)
The rise in food prices is concentrated in three categories: meat, oils and fats, and confectionery (Table 1). Among these, meat has the largest weight in the food inflation basket at 15.6 per cent, compared to 3 per cent for oils and fats and 9.4 per cent for confectionery.
Meat, butter and chocolate prices have increased sharply in 2025
Table 1. Year-on-Year growth rate of food prices in Ireland

Accessibility: This table shows that the rise in food prices up to July 2025 is concentrated in three categories: meat, oils and fats, and confectionery.
Going further, the data indicate that very specific items in these three categories are driving overall food price inflation. Within oils and fats, the rise has been primarily driven by butter, which recorded an average price increase of 15.2 per cent in 2025, due to reduced milk supply and constrained production in Europe alongside extreme weather affecting feed availability for herds. In the sugar, jam, honey, chocolate and confectionery category, the upward pressure has been concentrated in chocolate, with average increase of 15.1 per cent with respect to last year’s prices. This has arisen with cocoa prices exceeding $12,000 per tonne as harvests in West Africa have been poor due to storms, droughts and crop diseases.
However, meat remains the largest contributor to food inflation, accounting for 1.4 percentage points of the 4.6 per cent year-on-year increase in food prices in July (Figure 1). Within the meat category, the rise is concentrated in beef and veal, which saw a 23 per cent year-on-year price increase. In contrast, pork prices rose by just 0.8 per cent, and poultry by 4.2 per cent.
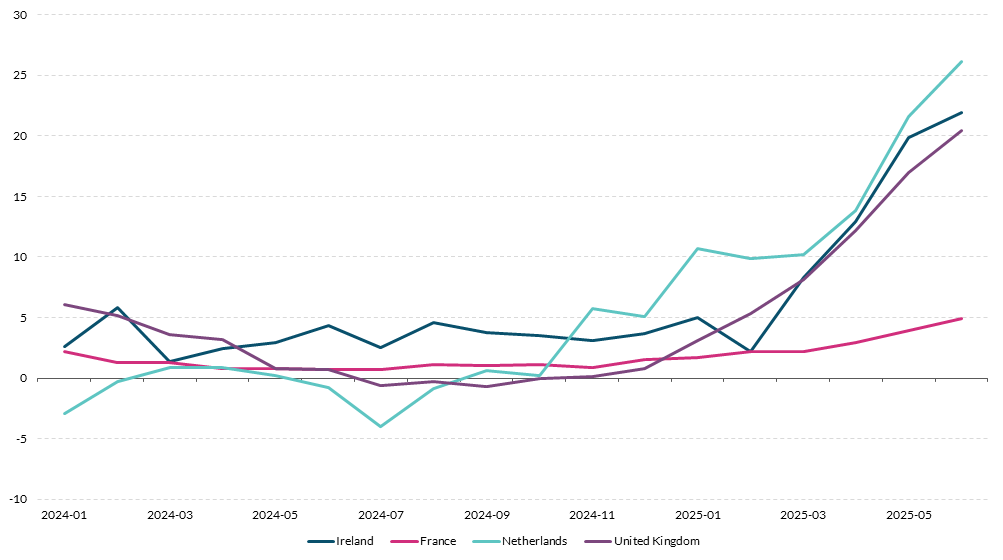
Ireland is currently the fifth largest world exporter of beef and veal, and similar consumer price trends for these products can be seen in the UK, which is Ireland’s top beef export market, to where currently over 40 per cent of Irish beef produce is exported (Figure 2). After the UK, Ireland’s next largest export markets are France and the Netherlands, accounting for roughly 13 and 9 per cent of Ireland’s beef export volume, respectively. Nineteen per cent of exports are sold to other markets within the EU. These countries have all seen a rise in consumer meat prices since the beginning of 2025, where the latest beef and veal prices for the UK and the Netherlands are over 20 per cent higher year-on-year, while data for France remain elevated but more modest. This raises the question: what explains the increase in consumer beef prices in Ireland that is also being observed in the UK and some EU countries?
Recent consumer price increases in Beef and Veal are also evident in other European countries
Figure 2: Beef and Veal Prices (Year-on-Year % change)
Source: European Commission. Chart data in accessible format. (CSV 0.48KB)
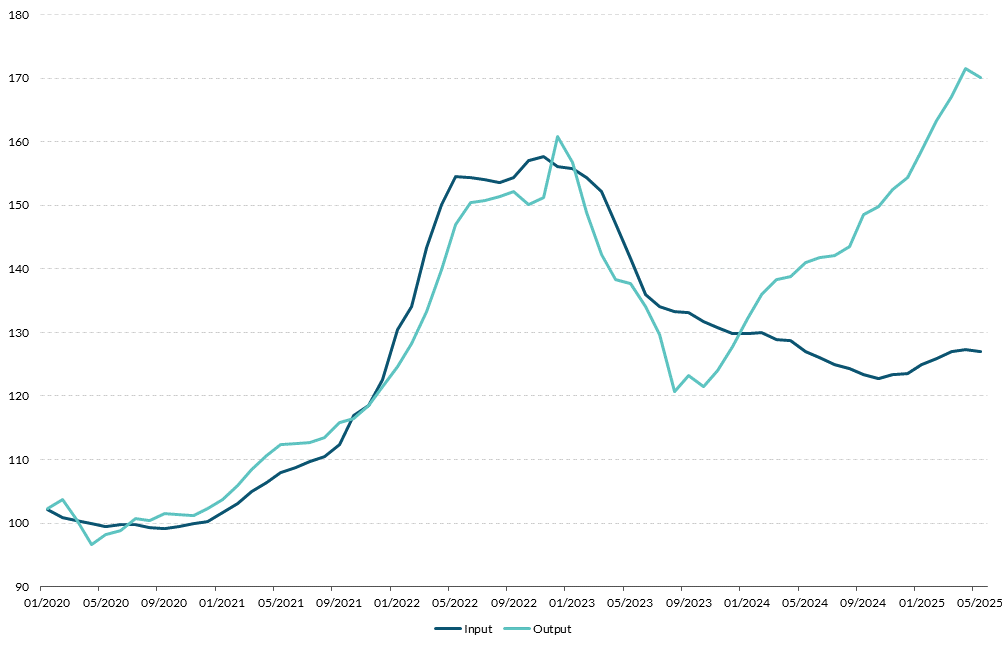
This increase in beef and veal prices does not appear to be the result of a pass-through of input prices, which have stabilised since mid-2023 (Figure 3). While fertiliser prices increased by 10 per cent year-on-year in June, this is insufficient to explain the 20.7 per cent rise in farm gate output prices for beef, driven by a nearly 50 per cent increase in cattle prices. This suggests that the current surge instead reflects tight external supply and demand pressures rather than the pass-through of input prices at the farm gate level.
Agricultural output prices have increased at a faster pace than input prices since early 2024
Figure 3: Agricultural Input and Output Prices Index in Ireland
Source: CSO. Chart data in accessible format. (CSV 1.59KB)
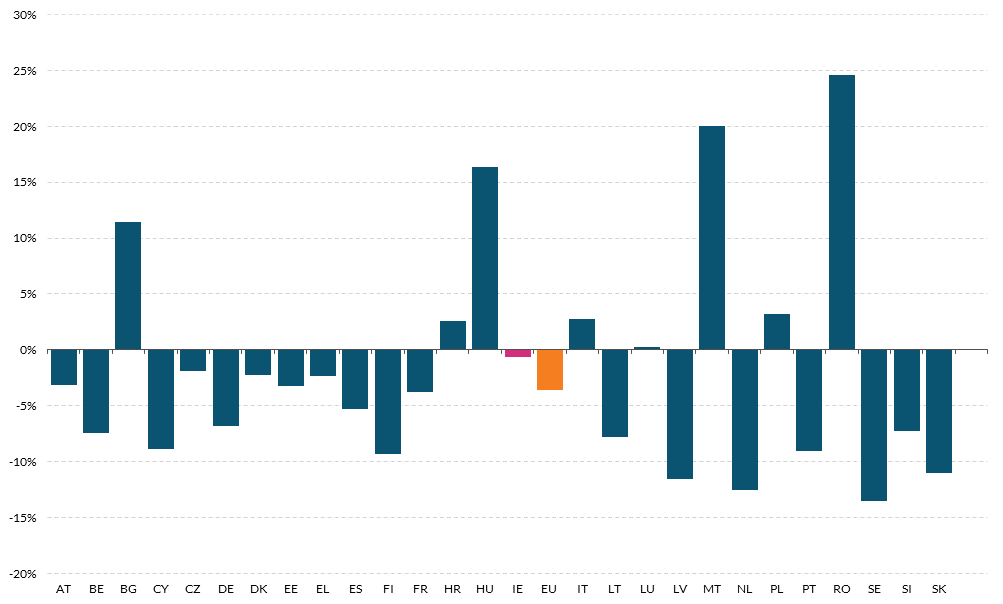
Looking at the supply side, EU beef and veal production is down by 3.6 per cent across the bloc since the beginning of 2025. Supply contractions are widespread, with notable declines from major producers as well as some of Ireland’s top export markets such as the Netherlands, France and Germany (Figure 4). While production in Ireland is relatively stable, live exports from Ireland have increased, and were up by 20 per cent year-on-year by mid-2025.The UK shows a very similar profile, with overall supply down by 4 per cent in the first half of the year when compared to 2024. This supply contraction is part of a longer-term trend, with the EU breeding herd shrinking by 1 to 3 per cent annually since 2017. Despite rising prices, demand for beef has been relatively inelastic, both domestically and in key export markets.
The imbalance between tight supply and steady demand has driven up live animal and carcass prices across the EU and UK, which, in turn, has pushed up farm gate prices in Ireland. It is this increase in cattle and carcass prices at farm gate level – which reflects the interplay between demand and supply developments in Europe – that appears to be the main factor accounting for the rise in consumer prices for meat in Ireland over recent months. The Industrial Producer Price Index published by the CSO measures the change over time in the selling prices received by domestic producers of goods and services. Consistent with the rise in farm gate prices, domestic producer prices for meat and meat products have increased over the first seven months of the year. In July, producer prices for meat and meat products were 6.7 per cent higher than in July 2024.
EU Beef and Veal supply tightens across Europe
Figure 4: Year-on-Year change in Beef and Veal Production up to May 2025
Source: European Commision. Chart data in accessible format. (CSV 0.31KB)
Looking ahead, the demand and supply factors behind the rise in meat prices in 2025 appear structural in nature, implying that prices are expected to remain at elevated levels but the rapid increases observed over recent months are unlikely to persist. The latest OECD outlook points to a moderation in global beef prices over the medium term influenced by slowing demand, reduced real feed costs and continuous productivity improvements. Should this occur, it implies that inflation in beef prices at the retail level in Ireland should decline to reflect the stable (though higher) farm gate price level for cattle carcasses in the EU. More broadly, the technical assumptions on international food commodity prices underpinning the overall forecasts for food inflation in the Bulletin envisage a slowdown in the pace of price growth out to 2027. While recent spikes in food price inflation are expected to ease, the outlook remains sensitive to unexpected supply and demand shocks affecting specific products.
Box B: The pass-through of expected house price changes to inflation expectations
by Gabriel Arce Alfaro and Prachi Srivastava
Expectations about the economy’s future performance play a pivotal role in macroeconomics, particularly for central banks seeking to understand how households form inflation expectations. Households’ beliefs about future inflation influence current price levels through consumption-savings decisions and wage-setting, thereby affecting inflation dynamics. Evidence suggests that expectations or experiences of house prices significantly shape households’ inflation expectations, as housing is both a consumption good and a key asset. Expectations about house prices, therefore, influence broader views on price developments (D’Acunto et al (2023) and Dhamija V. et al (2025)).
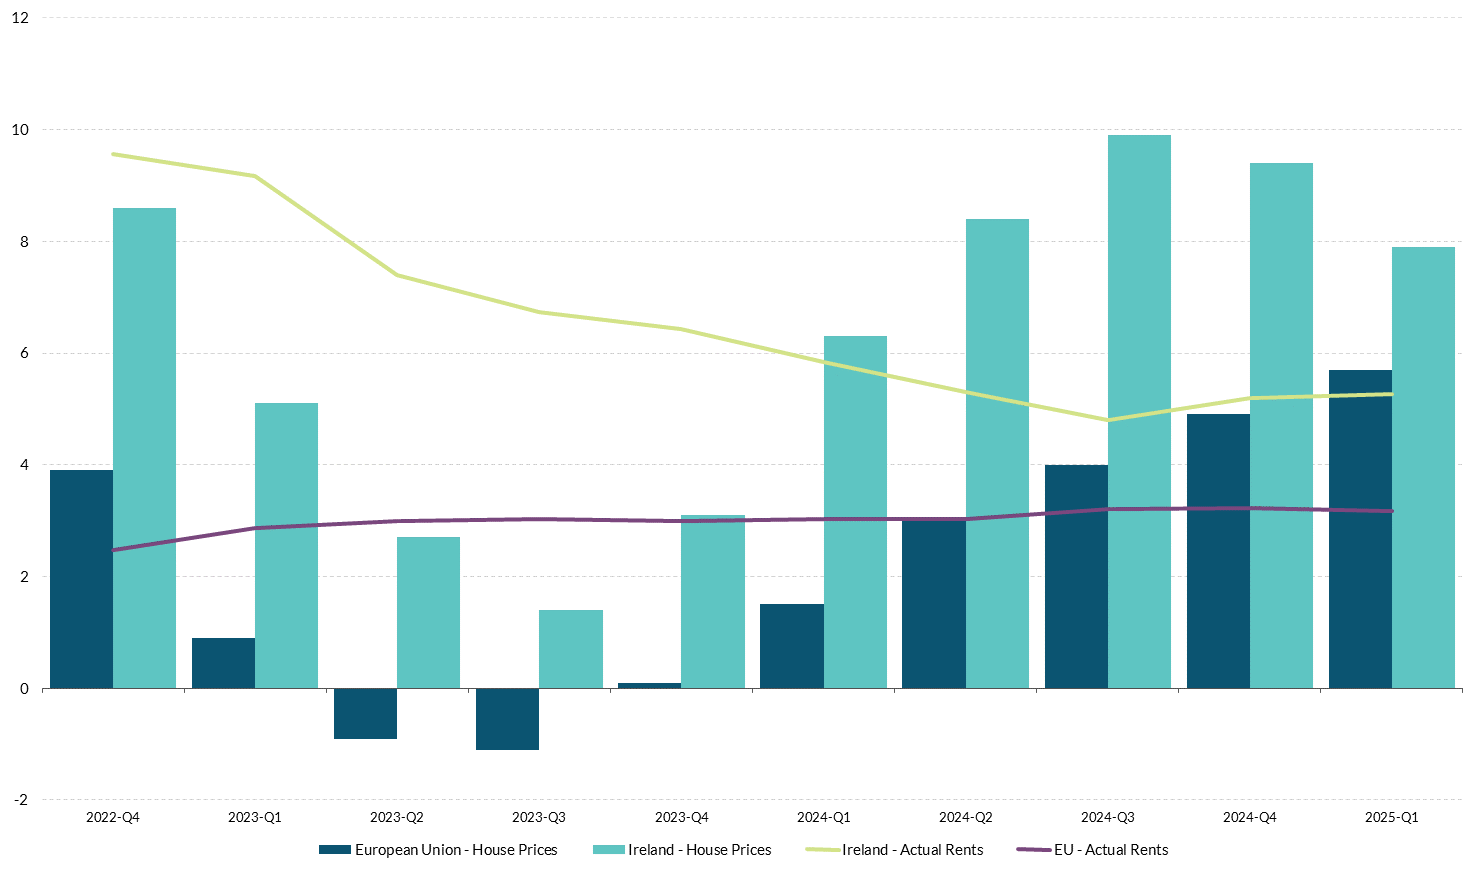
Housing inflation in Ireland has remained above EU average in recent years
Figure 1: Year-on-year price changes
Source: Eurostat and Central Bank calculations. Chart data in accessible format. (CSV 0.43KB)
In Ireland, house prices and rental inflation have consistently outpaced the euro area average (Figure 1). The divergence in housing-related inflation and headline HICP inflation has also been larger in Ireland, contrasting with the euro area average, where the two have for the most part remained aligned. This divergence highlights the importance of examining not only actual housing market developments but also households’ expectations of future house prices. Housing’s significant role in household budgets means expected house prices can influence inflation expectations through cost-of-living and wealth channels. The strength of this pass-through may vary by tenure group: homeowners may view rising house prices as wealth gains, while renters associate them with higher future rents and living costs. Understanding these differences is crucial for analysing how housing market expectations shape inflation dynamics in Ireland.
Ireland has experienced a substantial increase in house prices in recent years. According to the CSO Residential Property Index, national house price inflation rose to 8.3 per cent year-on-year in 2025Q1, up from 5.4 per cent in 2024Q1, while HICP inflation was just 1.9 per cent over the same period. Although the consumer price index reflects only consumption-related housing aspects (e.g., rents, housing services, utilities), a long-run relationship between house prices and rents is well established. Thus, changes in house prices indirectly affect consumer price inflation through their impact on rents.
This raises a key question: how do households’ expectations of housing market developments, particularly house prices, shape their overall inflation expectations? Using the ECB Consumer Expectation Survey (CES), we examine the relationship between expected house price developments and inflation expectations. The literature in this area highlights the long-run relationship between housing market dynamics and inflation, with expected house prices influencing inflation expectations through two channels. First, households may anticipate that higher house prices will lead to future upward adjustments to rents. Secondly, house prices affect both household expenses and wealth, shaping broader inflation expectations.
Housing services costs’ weight in household budgets further underscores the relevance of this link. Housing and related services account for 15–18 per cent of the consumer basket in both Ireland and the EU. However, in Ireland, actual rents comprise 50–60 per cent of total housing services expenditure, about 20 percentage points higher than the EU average. This higher share is accompanied by elevated rent inflation, which has exceeded headline inflation since 2018. For instance, while EU housing services inflation peaked at 24 per cent in 2022, Ireland’s peak was significantly higher at 31.8 per cent in October 2022.
Expenditure on actual rents in Ireland is 20 percentage points higher than the EU average
Figure 2: Expenditure Share
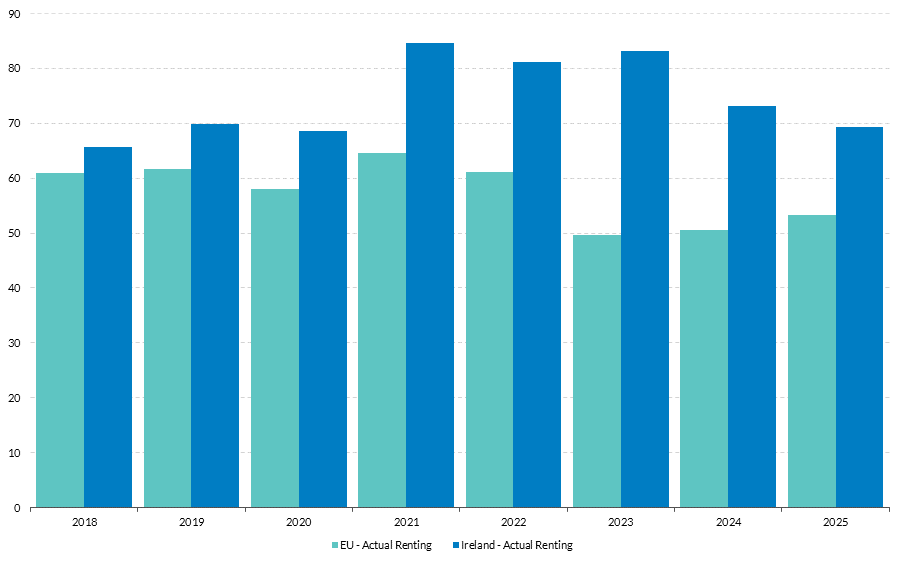
Source: Eurostat and CSO. Note: The vertical axis measures the weight of categories in the overall HICP which is out of 1000 parts. Chart data in accessible format (CSV 0.38KB)
Irish households also report higher inflation expectations than the EU average. During the inflation surge in mid-2022, Irish households’ one-year-ahead inflation expectations exceeded the EU average by 4 per cent (Figure 3). Renters in Ireland consistently expect higher inflation than homeowners, by approximately 1.5 per cent, reflecting the salience of housing costs. In contrast, at the EU level, renters, outright owners, and mortgagors report similar inflation expectations.
Renters report higher inflation expectations on average in Ireland
Figure 3: Inflation expectations
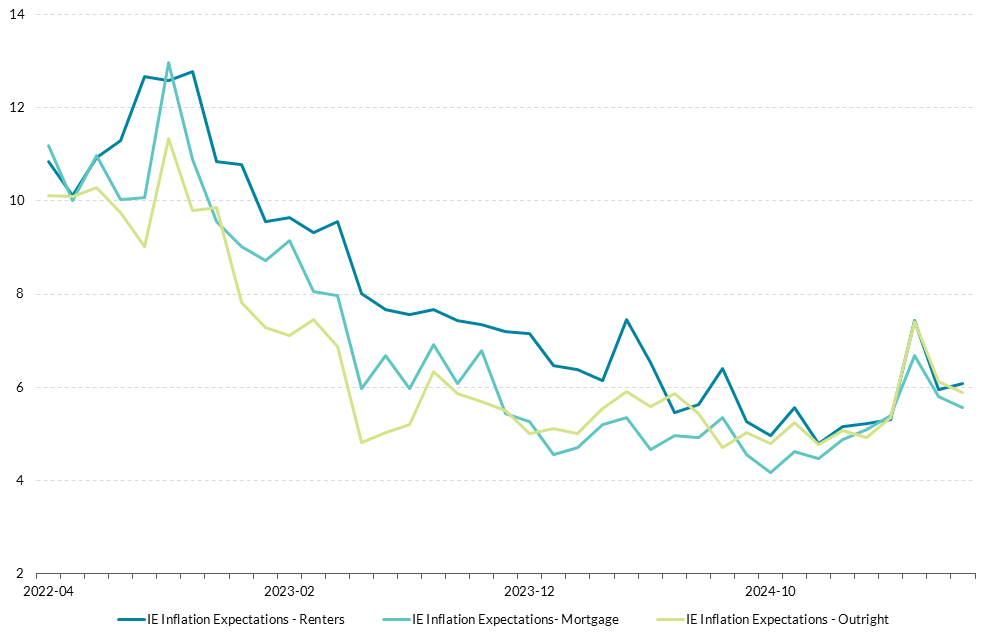
Source: Consumer Expectation Survey data and Central Bank of Ireland calculations. Chart data in accessible format. (CSV 4.41KB)
A similar pattern emerges for expected house prices. In Ireland, renters anticipate higher future house prices than homeowners and mortgagors, by roughly 2 per cent between 2022 and mid-2024 (Figure 4). At the EU level, expected house prices are broadly aligned across tenure groups. These differences highlight the importance of housing costs for renters in Ireland.
Irish average house price expectations are higher among renters
Figure 4: House Price Expectations
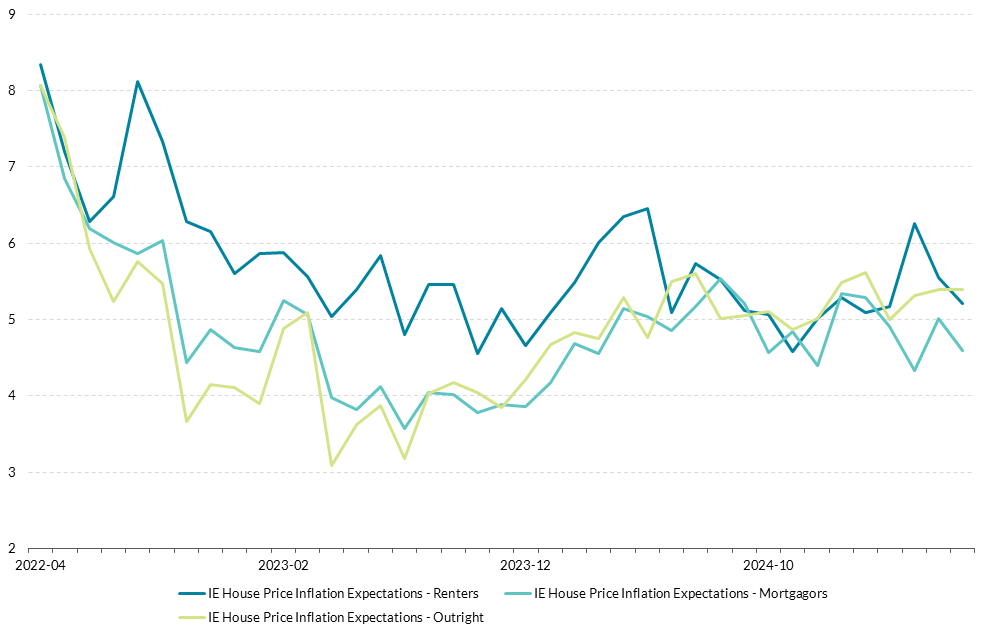
Source: Consumer Expectation Survey data and Central Bank of Ireland calculations. Chart data in accessible format. (CSV 4.44KB)
Note: CES data for Ireland is available from April 2022.
What do survey data tell us about the relationship?
Using the CES survey data, we measure how much house price expectations pass through to overall inflation expectations. We find that when households anticipate higher house prices over the next 12 months, they also tend to raise their short-term inflation expectations. This relationship holds across different groups of households and is stronger in Ireland than in the euro area average (Figure 5). A linear regression of one-year-ahead house price and inflation expectations, controlling for individual characteristics (e.g., demographics, macroeconomic expectations, region, and time fixed effects), estimates the pass-through at 0.29–0.35 percentage points for the EU (including and excluding Ireland) and Ireland. The pass-through in Ireland exceeds the EU average by 0.07 percentage points, a statistically significant difference.
Housing stands out as more salient for Irish households’ inflation expectations
Figure 5: Pass-through of house prices to inflation expectations
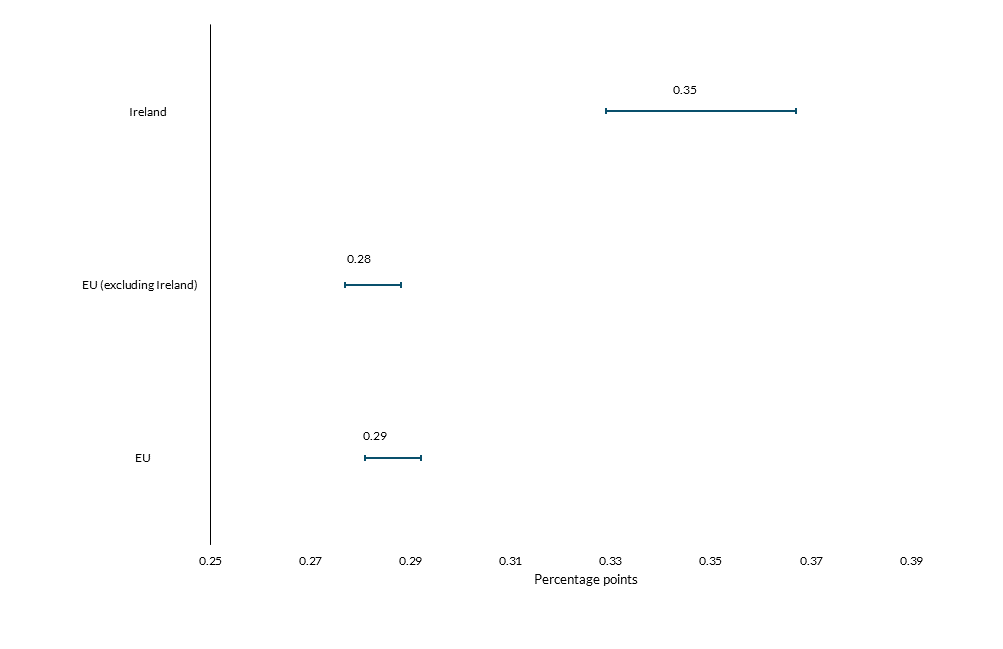
Source: Consumer Expectations Survey and Central Bank of Ireland estimations. Chart data in accessible format. (CSV 0.38KB) Note: The numbers represents the point estimate from our linear regressions and whiskers represents the 95 per cent confidence interval around the estimate.
Building on the differences observed across tenure groups, we analyse the effects further through the perspective of housing tenure. More specifically, we compare the differences between homeowners (outright owners and mortgagors) and renters. Figure 6 illustrates how the pass-through of expected house prices to inflation expectations differs across tenure groups. In both categories, the pass-through in Ireland exceeds the EU average by more than 0.06 percentage points. In Ireland, renters show a 0.05 percentage point higher pass-through compared to homeowners; however, given the shorter sample available for Ireland, the distinction between these two subgroups is less pronounced due to greater estimation uncertainty. These differences point at the potential role of tenure status in shaping how housing dynamics influence overall expected inflation.
Renters show higher pass-through to inflation expectations
Figure 6: Pass-through of expected house prices to inflation expectations by house tenure
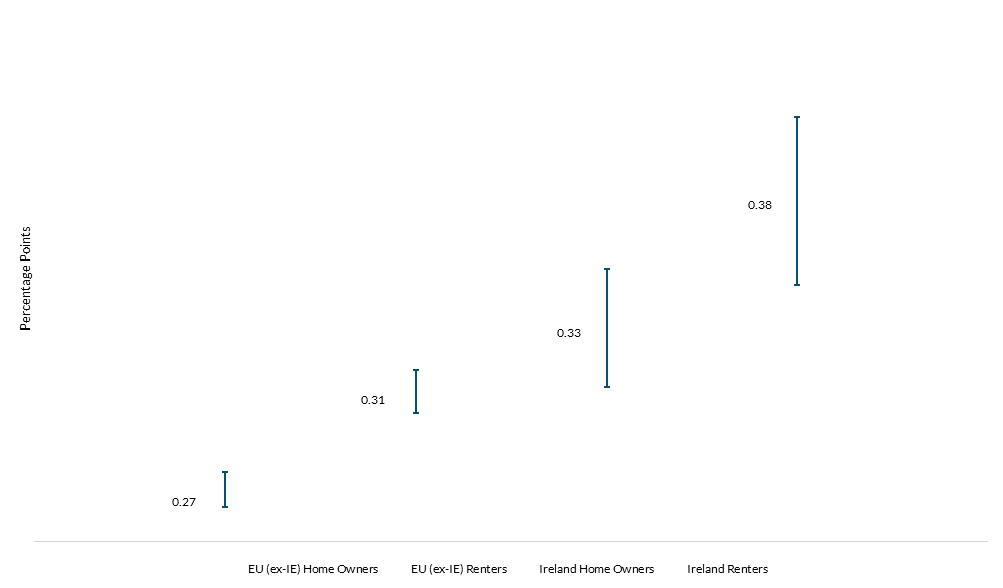
Source: Consumer Expectations Survey and Central Bank of Ireland estimations. Chart data in accessible format. (CSV 0.37KB)
Note: The numbers represents the point estimate from our linear regressions and whiskers represents the 95 per cent confidence interval around the estimate.
Recent literature has focused on how price changes in salient categories like food and energy shape inflation expectations. The analysis here highlights the similarly important role of housing, particularly in Ireland. The findings underscore how housing market dynamics, especially expected house prices and tenure group differences, significantly influence inflation expectations. Given the higher weight of housing costs in Irish household budgets compared to the EU average, housing market dynamics exert a stronger influence on expected inflation in Ireland. Monitoring expected house prices is important, as they can amplify inflation through the expectations channel, influencing consumption-savings decisions and short-term price dynamics.
An Timpeallacht Gheilleagrach
Tá gnóthaí, teaghlaigh agus lucht cinnteoireachta in Éirinn ag dul in oiriúint don timpeallacht athraithe i bhfianaise caidreamh eacnamaíoch trasatlantach nua atá ag teacht chun cinn. Cé nach bhfuil an t-ionchas eacnamaíoch chomh fabhrach agus a bheadh mura mbeadh na taraifí tugtha isteach ag na Stáit Aontaithe, tá na rátaí taraife éifeachtacha atá i bhfeidhm faoi láthair maidir le trádáil AE-SA ag an gceann íochtarach den raon leathan torthaí ab fhéideartha ag tús na bliana. Cé go bhfuil laghdú tagtha ar an éiginnteacht beartais, tá an éiginnteacht sin fós ábhartha ar bhonn intíre agus domhanda. Meastar go maolóidh an fuinneamh atá taobh thiar den fhás eacnamaíoch leis an athrú seo chuig timpeallacht sheachtrach nua. Ag an am céanna, tá srianta ó thaobh an tsoláthair de fós le feiceáil ar an bhfás inbhuanaithe sa gheilleagar intíre. Beidh iarracht chomhbheartaithe beartais de dhíth chun dul i ngleic leo. Trí amhlaidh a dhéanamh, i dteannta dinimiceas an ghnó áitiúil a chothú agus lánpháirtiú de facto na hÉireann i margadh aonair AE, neartófar an geilleagar i leith timpeallacht gheopholaitiúil níos scoilte thar an meántéarma agus cothabháilfear tarraingteacht an gheilleagair don infheistíocht dhíreach choigríche.
I neart OTI príomha sa chéad leath de 2025, léirítear go páirteach freagairt na bhfiontar ilnáisiúnta (FINanna) ar tharaifí ionchasacha SA le tús-ualú onnmhairí. Mar a cuireadh in iúl san Fhaisnéis Ráithiúil roimhe seo, áfach, bhí bunspreagadh d’onnmhairí ag teacht go háirithe ón tionscal leathnaitheach cógaisíochta freisin, mar aon leis an bhfás ar onnmhairí neamhchógaisíochta. Ag féachaint romhainn, beidh tionchar ar phríomhtháscairí gheilleagar na hÉireann ag an gcaoi ina n-iompróidh FINanna lena mbaineann costais mhéadaithe arna n-eascairt as constaicí taraife agus neamhtharaife níos airde. I dteannta luaineachtaí i ngníomhaíocht eacnamaíoch, féadfaidh go mbeidh luaineacht i mbrabúis FIN agus sa chothromaíocht choibhneasta idir trádáil earraí agus seirbhísí i dtéarmaí luacha agus méid araon sa ghearrthéarma agus sa mheántéarma. D’fhéadfadh costais mhéadaitheacha táirgthe agus costais dáileacháin cur isteach faoi dheoidh ar bhrabúsacht FINanna in Éirinn sa mheántéarma, agus bheadh tionchar diúltach aige sin ar ioncam ó cháin chorparáide i gcomparáid le treochtaí le déanaí. In éagmais aon athruithe ar bheartas intíre agus idirnáisiúnta, áfach, is dócha go dtiocfaidh méadú ar fháltais ó cháin chorparáide sa ghearrtéarma, fad a mheastar go rachaidh an t-easnamh bunúsach buiséid, lena n-eisiatar fáltais ó cháin chorparáide, in olcas arís.
San fhadtéarma, tá an baol ann go mbeidh sreafaí níos ísle infheistíochta ann mar aon le slabhraí luacha athstruchtúraithe FIN go háirithe má bhíonn athruithe níos leithne ar bheartas cánach agus ar bheartas tionsclaíoch SA. D’fhéadfadh sé sin bac a chur ar an bhfás ar ghníomhaíocht eacnamaíoch iarbhír agus ar fhostaíocht in Éirinn, rud a ghéaróidh na dúshláin don airgeadais poiblí. In Alt Sínithe a fhoilsítear in éineacht leis an bhFaisnéis seo, tugann taighde ón bhfoireann le tuiscint go bhfuil an fhéidearthacht ann go mbeidh ioncam náisiúnta na hÉireann tuairim is 1 faoin gcéad níos ísle san fhadtéarma de bharr chóras taraife nua SA ná mar a bheadh i gceist murach sin. Tá difríochtaí suntasacha ann ar fud na n-earnálacha éagsúla ó thaobh tionchar féideartha de, agus tugann samhlacha le tuiscint go mbeidh torthaí níos diúltaí i gceist don earnáil chógaisíochta agus don earnáil ceimiceán, ar earnálacha eachtracha iad don chuid is mó, fad gurb í an earnáil bia agus deochanna an ceann is suntasaí de na hearnálacha intíre a ndéantar difear dóibh. Tugann an anailís le tuiscint nach dócha go n-eascróidh laghdú suntasach ar infheistíocht choigríche reatha as na taraifí atá á dtabhairt isteach faoi láthair, ach tá cailliúint ionchasach tharraingteacht na hÉireann mar ardán onnmhairiúcháin do FDI nua ó SA ina phríomhriosca sa mheántéarma.
Ar an iomlán, tá an geilleagar intíre athléimneach i gcónaí go dtí seo in 2025, sa mhéid go ndeimhníonn sonraí Cuntas Náisiúnta ón bPríomh-Oifig Staidrimh an tuairim a chuireamar in iúl san Fhaisnéis Ráithiúil i mí an Mhárta maidir le fuinneamh an gheilleagair sa chéad leath den bhliain. Tá an fás ar fhostaíocht os cionn 2 faoin gcéad agus tá an dífhostaíocht sách íseal i gcónaí. Tá brúnna boilscitheacha intíre faoi smacht i gcónaí, ach bhí an boilsciú ar phraghsanna bia sách ard le déanaí mar gheall ar dhálaí soláthair níos géire i margaí mairteola na hEorpa (Bosca A). Tá an fás leanúnach measta ar fhíorioncaim indiúscartha thar thréimhse na réamhaisnéise, i gcomhthéacs margadh saothair cobhsaí, ag tacú leis an bhfás leanúnach measta ar chaiteachas tomhaltóirí.
Ar a shon sin, tá comharthaí áirithe ann go bhfuil an fuinneamh ag maolú. Tá laghdú tagtha ar an ráta folúntais poist agus bhí fás measartha ar ghníomhaíocht eacnamaíoch sna hearnálacha intíre den gheilleagar sa chéad leath de 2025. Cé go bhféafaidh go bhfuil an éiginnteacht maidir le beartas seachtrach ag cur isteach ar an ngeilleagar intíre, tá fás ionchasach inbhuanaithe an gheilleagair á shrianadh ag bearnaí i mbonneagar uisce, fuinnimh, iompair agus tithíochta. Mar gheall ar an mbearna sheasmhach idir soláthar seirbhísí tithíochta agus an t-éileamh ar na seirbhísí sin, tá praghsanna tithíochta agus cíosanna ag méadú ar luas níos tapúla ná ioncaim. Ó tharla go bhfuil ionchais na dtomhaltóirí Éireannacha maidir le boilsciú foriomlán á múnlú ag ionchais maidir le praghsanna tithíochta, tá rioscaí ann i gcónaí go mbeidh fás eacnamaíoch á shrianadh ag forbairtí sa mhargadh tithíochta agus, ina theannta sin, go mbeidh boilsciú níos airde ann ná mar a bheadh murach sin (Bosca A). Ar an iomlán, cé go bhfuil na rioscaí a bhaineann leis an ionchas don fhás eacnamaíoch níos cothromaithe ná mar a bhí san Fhaisnéis Ráithiúil i mí an Mheithimh, is rioscaí ar an taobh thíos iad i gcónaí.
Faoi láthair, is ionann boilsciú sa limistéar euro agus tuairim is 2 faoin gcéad, is é sin an sprioc mheántéarmach, agus bhí measúnú Chomhairle Rialaithe BCE ar an ionchas do bhoilsciú mórán gan athrú i ndiaidh a gcruinnithe i mí Mheán Fómhair i gcomparáid leis an gcruinniú socraithe beartais roimhe seo. I bhfianaise na sonraí atá ag teacht isteach, dhinimic an bhoilscithe bhunúsaigh agus neart an tarchuir beartais airgeadaíochta, chinn an Chomhairle Rialaithe ag an gcruinniú sin go bhfágfaí ráta na saoráide taisce gan athrú ag 2 faoin gcéad.
Leis na dúshláin ghearrthéarmacha agus na hiarmhairtí fadtéarmacha a bhaineann leis an timpeallacht athraitheach gheo-eacnamaíoch, leagtar béim ar an ngá atá le tosaíochtaí soiléire a bheith sa bheartas eacnamaíoch intíre.
Sa ghearrthéarma, níl tacaí fioscacha leathana riachtanach nó iomchuí, i bhfianaise chineál na turrainge agus leochaileachtaí bunúsacha san airgeadas poiblí. Ina ionad sin, is féidir tacú, laistigh de pharaiméadair reatha na ngníomhaireachtaí Stáit, le gnólachtaí dúchasacha onnmhairiúcháin—atá ar na gnóthaí is rathúla agus is táirgiúla in Éirinn cheana féin—chun líonraí agus margaí nua a fhorbairt. Go háirithe, tá acmhainneacht neamhshaothraithe trádála ag gnóthaí Éireannacha le Ballstáit AE eile, lena bhféadfaí tairbhe a bhaint as an margadh is mó ar domhan atá saor ó tharaifí (BCÉ, 2025). Ag obair i gcomhar le lucht déanta beartais AE chun constaicí trádála agus infheistíochta laistigh den Aontas Eorpach a laghdú, féadfar na deiseanna sin a thapú. Áirítear sa mhéid sin, dul chun cinn a dhéanamh maidir leis an Aontas Coigiltis agus Infheistíochta (SIU), rud a chabhródh le teaghlaigh in Éirinn agus le teaghlaigh ar fud AE torthaí níos airde a bhaint amach ar a gcuid coigilteas, fad a chuirfí rogha maoiniúcháin níos fearr ar fáil do ghnóthaí. Sa bhreis air sin, féadfar frithchuimiltí trádála a laghdú trí chórais íocaíochta Eorpacha a lánpháirtiú níos mó, rud a rachaidh chun tairbhe do ghnóthaí agus do theaghlaigh Éireannacha.
Chun dul i ngleic leis na dúshláin fhadtéarmacha ón scoilt gheopholaitiúil, ní mór dul i ngleic leis na srianta céanna ar fhás intíre a luaitear thuas trí bhearnaí i mbonneagar uisce, fuinnimh, iompair, agus tithíochta a líonadh. Tá sé seo riachtanach chun tarraingteacht na hÉireann don infheistíocht dhíreach choigríche a fheabhsú agus chun costais mhaireachtála agus ghnó a shrianadh. Féadfar infheistíocht phríobháideach a phlódú isteach le seachadadh éifeachtúil bonneagair phoiblí arna bhaint amach ní hamháin trí chaiteachas méadaithe caipitil ach trí athchóirithe lena luasghéarófaí amlínte tionscadal freisin. Ar a shon sin, tá rioscaí gearrthéarmacha maidir le costais aonad saothair agus boilsciú níos airde ag gabháil leis an méadú riachtanach ar ghníomhaíocht foirgníochta - earnáil ina bhfuil an táirgiúlacht faoi bhun an mheáin. D’fhonn na rioscaí seo a mhaolú, tá sé tábhachtach go ndéanfaí caiteachas caipitil phoiblí a nascadh le modhanna nuálacha seachadta agus scála i dtionscadail infheistíochta a spreagadh. Leis na tionscnaimh seo, féadfar tacú le táirgiúlacht, féadar brúnna boilscitheacha a mhaolú, agus féadfar an buntáiste eacnamaíoch ó infheistíocht phoiblí a uasmhéadú. Ar bhonn níos leithne, cuirfear le fás táirgiúlachta níos airde freisin trí dhinimiceas gnó níos fearr a éascú, mar aon le hathdháileadh caipitil níos éifeachtúla, de mar a thiocfaidh gnólachtaí óga chun cinn.
Tá an gá go laghdófaí rioscaí don airgeadais poiblí tar éis éirí níos géire, ar rioscaí iad a eascraíonn as bonn cánach atá ró-chúng, i bhfianaise an spleáchais ar fháltais ó cháin chorparáide ó líon beag FIN a fhéadfaidh a bheith níos leochailí mar gheall ar an scoilt gheo-eacnamaíoch. Sa Tuarascáil ón gCoimisiún um Chánachas agus Leas in 2022, cuireadh roghanna inmharthana i láthair maidir le fairsinge an bhoinn cánach a choimeád ar bun agus a leathnú ar fud faoiseamh cánach, cánacha maoine agus tomhaltais agus ranníocaíochtaí árachais shóisialta, fad a chaomhnófar, nuair is iomchuí, méid an dul chun cinn sa chóras cánach ioncaim phearsanta. Le bunú an Chiste um Éire sa Todhchaí agus an Chiste um Bonneagar, Aeráid agus an Dúlra, níltear ag dul i ngleic ach go páirteach le brúnna breise caiteachais phoiblí atá ar eolas, ar brúnna iad a thiocfaidh chun cinn sna 2030idí agus ina dhiaidh sin. Tá an tiomantas do bhonn inchreidte fioscach lena n-áirithítear fás inbhuanaithe ar ghlanchaiteachas rialtais ríthábhachtach i gcónaí. Ar an gcaoi sin, bhunófaí beartas fioscach éifeachtach fritimthriallach, rud a chumasódh don airgeadas poiblí tacú leis an ngeilleagar de réir mar is gá, agus a neartódh an t-airgeadas poiblí le imeacht ama. Is gá go mbeidh bonn inmharthana tiomsaithe ioncaim ag gabháil le fás ar chaiteachas rialtais, go háirithe caiteachas reatha athfhillteach, i bhfianaise na leochaileachtaí arna n-eascairt as róchaiteachas seasmhach agus easnaimh bhunúsacha buiséid. Sa bhreis air sin, tá sé ríthábhachtach go leathnófar an bonn cánach d’fhonn an acmhainn fhioscach agus eacnamaíoch a chruthú chun infheistíocht i gcaipiteal poiblí a mhéadú mar atá beartaithe sa Phlean Forbartha Náisiúnta agus chun na costais mhéadaitheacha atá ag teacht chun cinn a chlúdach d’fhonn seirbhísí poiblí a choimeád ar bun ag a leibhéil reatha.
Endnotes