Robert Kelly, Director of Economics & Statistics, Central Bank of Ireland
What is the outlook for the Irish economy?
Domestic economic activity is projected to continue to grow, although the pace of growth is slowing, as businesses are showing signs of becoming more cautious around investing.
There has also been a surge in first quarter exports, partly due to frontloading ahead of anticipated tariff changes.
The big question now is how trade negotiations will play out, including the level and coverage of tariffs.
In a more adverse scenario, where uncertainty intensifies and trading conditions deteriorate, our estimates show growth would dramatically slow – by as much as half.
This would put average annual growth in the domestic economy at just over 1 per cent out to 2027.
How can policy benefit the Irish economy?
Looking ahead, we're expecting continued improvement in debt sustainability, on the back of strong public finances.
However, this positive outlook is fragile and could shift quickly. Our tax base is narrow and dominated by multinational firms exposed to shifts in global trade.
To build a more sustainable financial future and withstand demographic pressures, we need to broaden our tax base and establish a credible budgetary anchor to ensure long-term stability.
Although uncertainty is currently high, it's not expected to be permanent.
So, what actions can policymakers take?
They should focus on strengthening the economy's long-term growth potential by investing in infrastructure, boosting productivity, and encouraging private investment. Such actions will lay the foundation for future growth and enhanced living standards.
Comment
With the global economic backdrop continuing to shift, heightened uncertainty remains a consistent feature shaping the outlook for the Irish economy. As a small, open economy with significant trading and investment relationships with the US and EU, Ireland is experiencing, and can be expected to further experience, the fallout from changing geoeconomic relationships and priorities. During this transition, parsing through events, announcements and data to extract meaningful signals on the prospects for the various sectors of the economy will remain difficult. However, with near-to-medium term headwinds for economic activity from both international and domestic sources, opportunities arise for domestic policy to build long-term resilience in the economy and public finances by bolstering the supply side of the economy.
Policy uncertainty, in particular related to significant shifts in US trade policy, has directly shaped headline economic activity in Ireland so far in 2025. The exceptionally strong exports and GDP outturn in the first quarter in part reflected multi-national enterprises (MNEs) response to the prospects for the imposition of tariffs or other measures later in the year. Despite this front-loading of activity, which was most notable in the pharmaceuticals sector, longer-term market expectations for the profitability of MNEs across pharma, med-tech and ICT manufacturing operating in Ireland are more negative than previously in-light of the shifting US policy stance (Box 2).
The approach of those MNEs affected to absorb the higher costs of production related to higher tariff and non-tariff barriers will be reflected in key metrics of the Irish economy. Alongside measured activity, profits are most likely to fluctuate in the near-to-medium term. In isolation, higher costs of production and distribution would be expected to eventually reduce profits of MNEs in Ireland, with negative implications for corporation tax receipts relative to the experience to date. Over the longer term, especially if tariffs were accompanied by wider tax and industrial policy changes, there is a risk that more fundamental declines in investment flows and alternative structures for MNE value chains could result in a significant drag on real economic activity and employment in the State, compounding the challenges for the public finances. In a Signed Article published alongside this Bulletin, Boyd et al (2025) (PDF 0.98MB) illustrate the implications of such a scenario, which could see the general government balance swinging into a deficit of over 4 per cent of GNI* by 2030, with general government debt rising to over 90 per cent of GNI* over the same period.
Prospects for Irish-owned exporters and domestic investment and consumption are not immune from geoeconomic developments. The central outlook for the domestic economy, while damped further by the effects of higher uncertainty and higher effective tariffs since the previous forecast in March, remains relatively favourable out to 2027. Unemployment is expected to stay low while consumer price inflation is forecast to remain at sustainable levels. Relatedly, household real incomes are likely to continue rising, supporting a steady pace of growth in consumer spending. However, near-term prospects for investment are less buoyant, which in turn places further constraints on the prospects for the potential growth rate of the economy over the medium-term. Physical business investment is likely to be particularly affected by heightened uncertainty. Housing investment, while expected to increase gradually, will likely remain insufficient to bridge the gap between supply and estimated demand in that market.
The outlook is particularly sensitive to how effective tariff rates evolve with ongoing negotiations, the degree of policy uncertainty and the impact on financing conditions. Given the range of possible paths for the economy, the central forecast in this Bulletin is accompanied by a more adverse scenario which sees a more severe deterioration in trade conditions, more persistent levels of policy uncertainty, and tighter financing conditions. While in the more adverse scenario the expected pace of growth in GDP and MDD is significantly lower over the forecast horizon to 2027 than in the central case, a contraction in economic activity does not arise. However, as noted above, even more substantial shifts in direct investment and value chains could arise over the medium-to-longer term horizon. Moreover, the projections in both the central forecast and the adverse scenario are subject to a high degree of uncertainty since the various tariff scenarios being considered are largely without recent historical precedent, especially at a time when the global economy has been so integrated.
While the uncertainty related to the geoeconomic backdrop points to more muted economic growth outcomes with further downside risks, the implications for inflation are less clear cut, with potential upside and downside risks. Over the near-to-medium-term, however, the central outlook for inflation both in Ireland and in the euro area as a whole is broadly favourable. From a euro area perspective, indications suggest inflation will settle at around the Governing Council’s 2 per cent medium-term target. Based on its latest assessment of the inflation outlook, the developments in underlying inflation measures and the strength of monetary policy transmission, the Governing Council decided in June to reduce policy rates further by 25 basis points. Future policy rate decisions will continue to be made on a similar basis to ensure inflation stabilises sustainably at the 2 per cent medium-term target.
Domestic factors can mitigate or counteract the negative effects of external headwinds to the drivers of long-term sustainable growth in the Irish economy. Taking a longer-term perspective, increasing levels of educational attainment have been a substantial driver of growth in the Irish economy in recent decades. Compared with other EU Member States, higher levels of human capital through education has been a more significant contributor to growth in Ireland through its positive impact on labour force participation, employment and productivity (Box 3). The share of the working age population with third-level education in Ireland is now the highest in the EU. Consequently, future marginal gains to support long-term growth will likely have to come from other means than just increasing the number of people with third-level qualifications. This would include greater alignment of skills to roles, or reducing the potential for job mismatch, including through initiatives to support life-long learning and mid-career training, especially in-light of the pace of change in digitalisation and other technological advances.
Beyond enhancing human capital, improvements in other factors of production can also significantly contribute to long-term sustainable growth. Some sectors, such as construction, stand to gain significantly from investing in machinery, equipment and more widespread adoption of new technologies to boost the sector’s productivity. Increasing productivity in the construction sector is essential to enable it to fulfil the increasing demand for housing and related water, energy, transport and communications infrastructure. These are immediate constraints on the economy’s capacity to grow and to protect Irish living standards broadly and sustainably both now and in the future. If the underlying demands in building and construction activity for new housing, retrofitting and public infrastructure were to be met at existing levels of productivity over the next three years, an estimated increase of 30 per cent in construction sector employment would be required (Box 1). This is about three times its long-term average rate and multiples the rate of expected overall employment growth. Bringing construction sector productivity in Ireland up to the average across comparable European economies could achieve greater output while reducing the need for such a rise in employment for relatively scarce skillsets. Policy interventions can help drive productivity gains through, for example, linking public procurement with the use of innovative methods, or considering the role of land use regulation and land value capture measures in incentivising scale of projects in areas of high demand.
Domestic economic policy has an opportunity to achieve the complementary aims of maintaining sustainable economic growth and building longer-term resilience in light of the major transitions the economy is undergoing. Fiscal policy requires carefully balanced calibration to ensure sufficient economic and fiscal space to sustainably achieve the necessary rise in public capital expenditure needed to address infrastructure gaps in housing, water and energy over the near-to-medium term, including those arising to address climate change. At the same time, the need to reduce the risks to the public finances from an excessively narrow tax base has become more immediate, given the reliance on corporation tax receipts from a small number of MNEs, which may be more vulnerable in light of geoeconomic fragmentation. Buffers have begun to be built through the establishment of the Future Ireland Fund and the Infrastructure, Climate and Nature Fund. However, in and of themselves they do not remove the need to firmly place the public finances on a sustainable long-term path. Committing to a credible fiscal anchor that enforces sustainable increases in net government expenditure over time remains a priority. This will enable effective counter-cyclical fiscal policy and more resilient public finances over the longer-term. Relatedly, taking concrete action to broaden the tax base would create the necessary fiscal and economic space, within the context of a credible fiscal anchor, to enable the necessary rise in public capital expenditure and fund other known costs to maintain existing levels of public services as the needs of the population evolve.
Public capital investment alone will not be sufficient to address the housing and wider infrastructural gaps that have emerged. Consequently, fiscal and broader public policy should more actively consider reforms to crowd-in private investment. Amongst the opportunities here is achieving progress on Savings and Investment Union (SIU), enabling greater prospects for households in Ireland and across the EU to increase returns on their savings and providing a greater choice of funding for private productive investment. More generally, a concerted effort to reduce remaining barriers to intra-EU trade and investment and realise more benefits of the EU Single Market could prove an effective response to the economic consequences of wider global geoeconomic fragmentation.
Outlook for the Irish Economy
Recent Developments and Forecast Summary
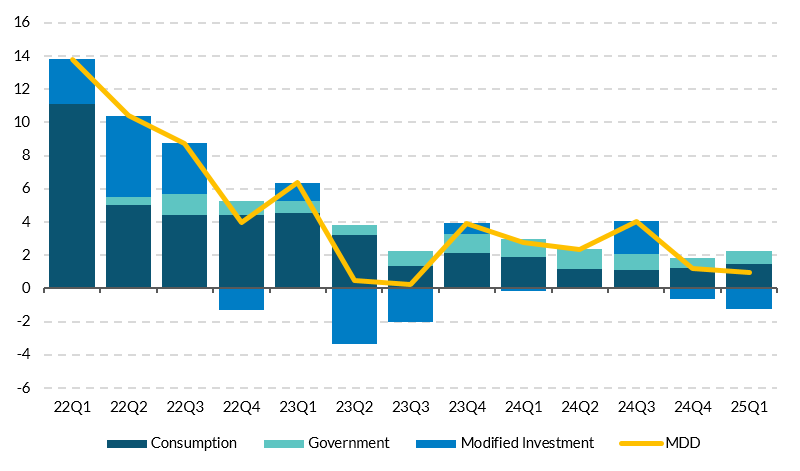
Domestic economic activity remained broadly steady in the first quarter of 2025. Economic activity (Modified Domestic Demand) expanded by 1 per cent in Q1 2025 compared to the same quarter in 2024. The growth in activity was unevenly distributed, with consumer and government expenditure contributing to the expansion while modified investment contracted (Figure 2). The decline in modified investment during Q1 was largely driven by weakness in machinery and equipment. Government spending contributed 0.8 percentage points to MDD growth in the quarter. Employment increased by 1.3 per cent in Q1 2025 compared to the previous quarter.
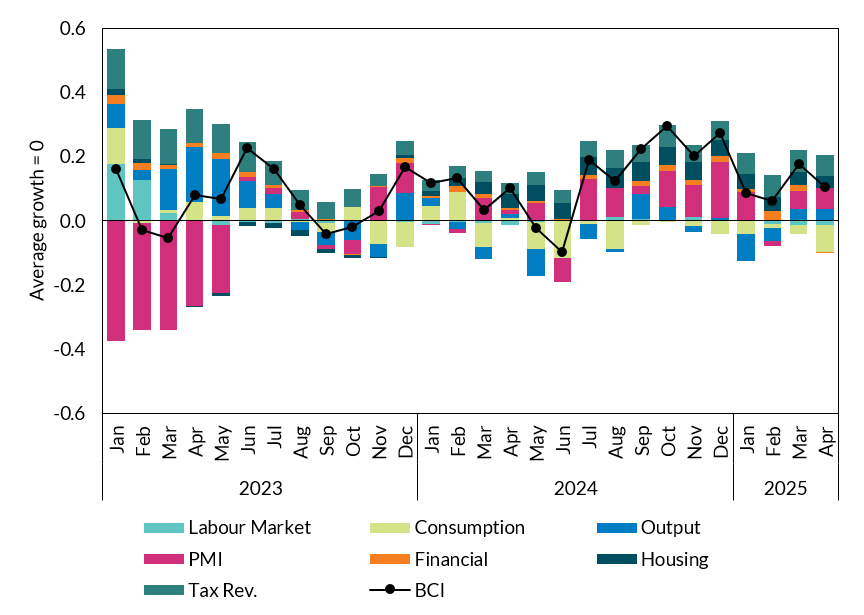
A sharp rise in pharmaceutical exports to the US resulted in a large increase in headline GDP in Q1 2025. Most notably, the value of merchandise exports surged in the early months of 2025, up 64 per cent year-on-year in Q1, predominantly driven by exports to the US. While frontloading of exports ahead of anticipated US tariffs likely contributed to this, shipments of the active-ingredients in weight-loss drugs following the opening of new production facilities also boosted exports in Q1. At the same time there was a substantial import of intellectual property during Q1, with investment in this category almost doubling on a year-on-year basis. On the output side of the accounts, activity in the domestically-oriented sectors expanded by 1.3 per cent in Q1 2025 on a year-on-year basis with output in the MNE-dominated sectors rising by 42 per cent. The latter reflected the enormous rise in cross-border goods exports. Summarising the information from the latest high-frequency monthly data, the Central Bank Business Cycle Indicator (BCI) shows above average growth in the domestic economy up to April. The main positive drivers of the BCI so far in 2025 have been traditional sector output, PMIs and tax revenues, with the labour market contribution remaining neutral. A sharp decline in consumer sentiment led to a modest slowdown in the BCI for April. Employment grew by 3.3 per cent in Q1 2025, and while unemployment remains low at 4.3 per cent in the first quarter, labour demand continues to moderate in the first months of 2025.
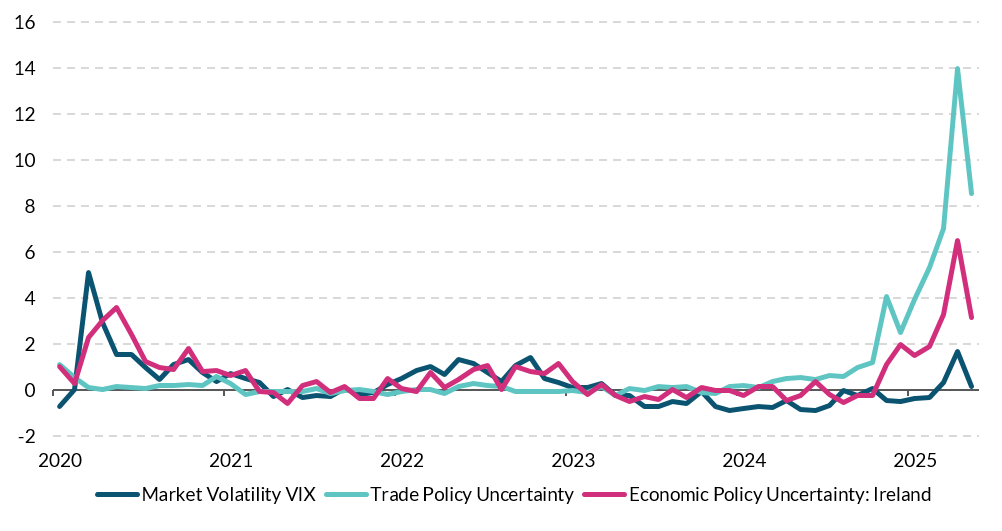
Uncertainty spiked in April driven by US trade policy announcements
Figure 1: Standardised measures of uncertainty (number of standard deviations)
Source: Federal Reserve Economic Data (FRED), Rice, J. (2023), Caldara et al. (2019) and Central Bank of Ireland calculations. Chart data in accessible format. (CSV 18.94KB)
Pace of MDD growth remained steady in Q1 2025
Figure 2: Contributions to year-on-year change in Modified Domestic Demand (MDD)
Source: CSO. Chart data in accessible format. (CSV 0.84KB)
The BCI indicates stable growth so far in 2025, consistent with annual MDD growth of around 2 per cent
Figure 3: Business Cycle Indicator and Contributions, Average growth = 0
Source: Central Bank of Ireland. Chart data in accessible format. (CSV 1.59KB)
Note: Details on the methodology underpinning the BCI available here (PDF 790.91KB).
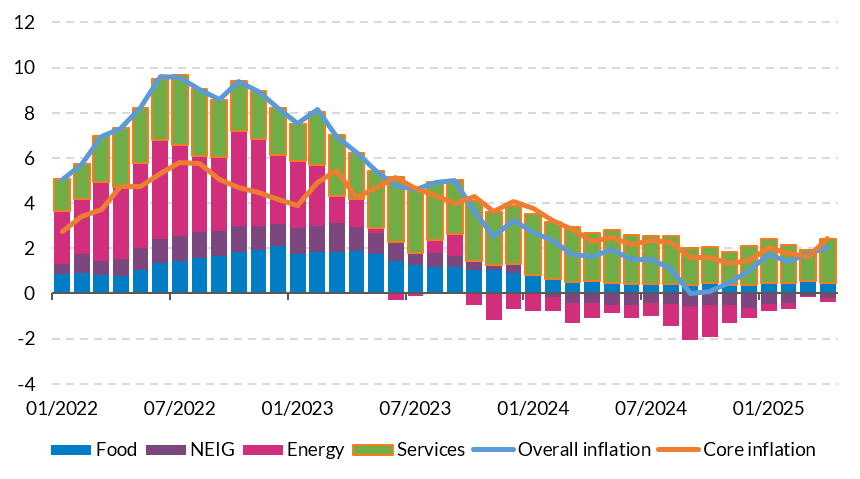
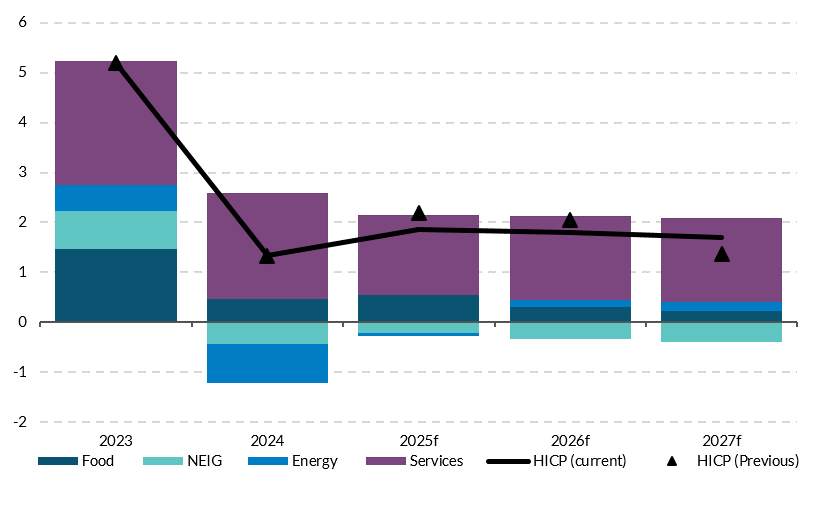
Domestically driven services inflation remains the largest contributor to overall price changes, with energy prices continuing to contribute negatively in 2025. The latest consumer price data up to May 2025 edged below 2 per cent, a slightly weaker outturn in comparison to the average observed during the first months of the year. Falling energy prices were the main driver behind this decline, partially offset by rising contributions from food components and a noticeable increase in the price of transport-related services in April. A range of measures of underlying inflation – stripping out some of these more volatile components – continue to point to inflation stabilising below 2 per cent in 2025. Services inflation remains well above the headline rate, reflecting relatively strong domestic demand. Supporting this, real average household disposable income grew by 1.1 per cent in 2025 Q1.
Headline inflation broadly steady around 2 per cent in 2025
Figure 4: Contributions to headline inflation (year-on-year per cent change)
Source: CSO and Central Bank of Ireland. Chart data in accessible format (CSV 3.48KB).
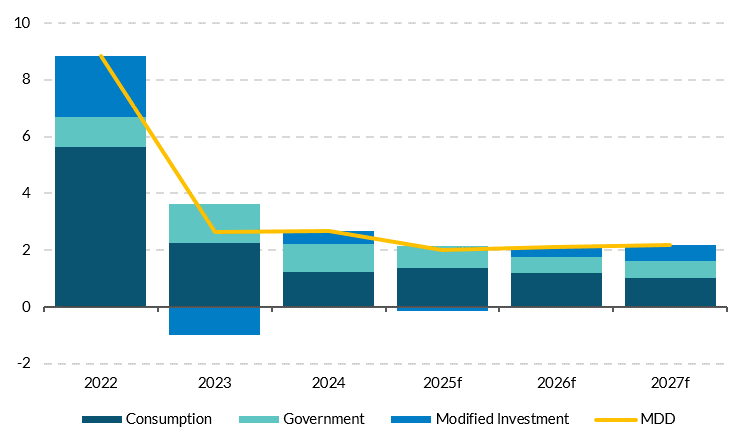
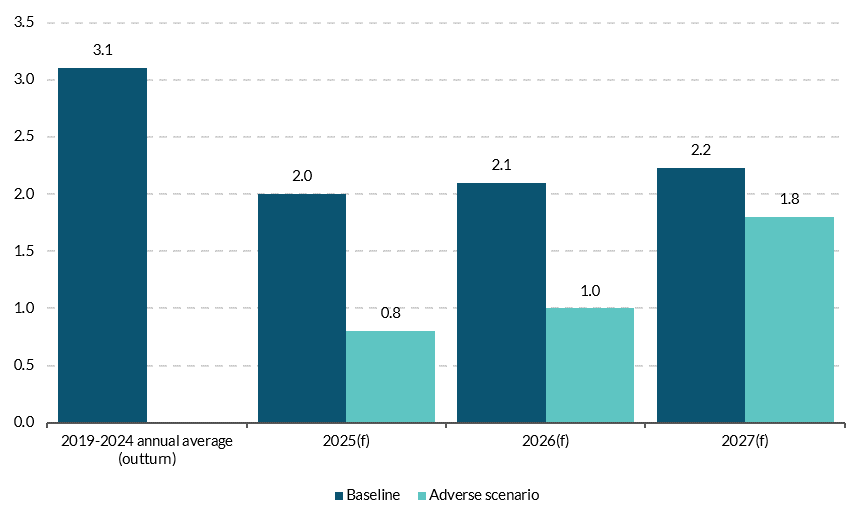
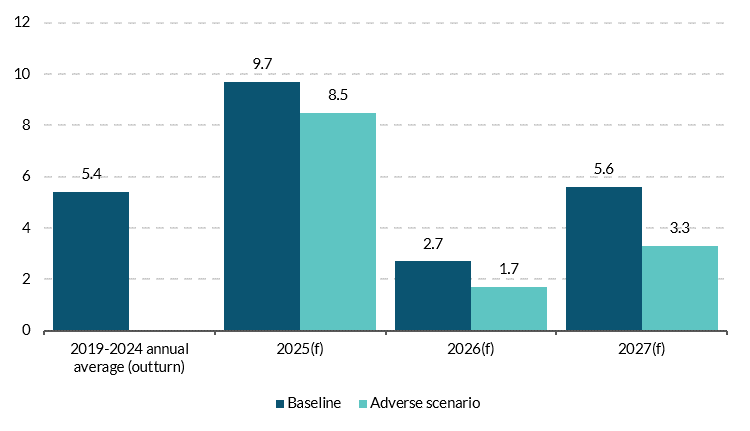
The announcement of US tariffs on April 2nd and accompanying increase in global uncertainty has resulted in a downward revision to the baseline forecast, with risks strongly tilted to the downside (Table 1). The assumption underpinning the baseline forecast follows announced policy. This implies that tariffs on many EU goods exports to the US will rise to 20 per cent from July 2025, following the end of the current 90-day pause on announced by the US Administration on April 9th, and remain at that level for the forecast horizon. The forecast also assumes continued heightened uncertainty until July 2025, diminishing subsequently. Given the absence of clarity about the eventual level of tariffs that will follow from negotiations with the US, an adverse scenario with persistently higher and broader tariffs, and elevated policy uncertainty is also considered in the Balance of Risks. Under the baseline, MDD is forecast to grow by 2.0 per cent for the full year in 2025 and by 2.1 per cent per annum on average in 2026 and 2027 (Figure 5). These projections mark a downward revision to the outlook from the last Bulletin in March 2025. Despite global headwinds, household consumption is forecast to remain steady and to be the main driver of MDD growth. Continued strength in the labour market is projected to support income growth, though both incomes and household savings are revised downwards from the previous Bulletin. Modified investment, while still an important contributor to MDD growth over the horizon, is revised down significantly in light of historically high uncertainty. Export growth for 2025 is revised up to 9.4 per cent relative to the previous Bulletin. While merchandise goods exports rose sharply in Q1, the baseline assumption is that this mostly reflects frontloading ahead of US tariffs, and that this portion of the increase (related to frontloading) will be offset by a decline in exports in the second half of 2025. ICT remains the main driver of services exports, though growth is expected to moderate over the forecast horizon. Putting together the forecasts for domestic economic activity and net trade, overall Gross Domestic Product (GDP) is forecast to grow by 9.7 per cent in 2025 and an average of 4.2 per cent from 2026-2027, with the current account balance stabilising over the forecast horizon. Modified Gross National Income (GNI*) – which removes distortions related to MNE activity that affect GDP – is projected to grow by 2.3 per cent on average in real terms from 2025 to 2027. Growth in GNI* is based on the forecast for modified domestic demand as well as expected improvements in net trade, based on activity that takes place in Ireland. The latter in turn underpins the projection for the modified current account (CA*) to remain in surplus over the forecast period.
In an adverse scenario, more widespread application of tariffs and prolonged uncertainty would result in significantly weaker economic growth than in the baseline. Higher uncertainty and effective tariff rates, alongside tighter financing conditions would lead to real MDD being approximately 2.5 per cent lower in 2027 than in the baseline forecast, with real GDP being 4.2 per cent below baseline.
Table 1: Baseline Forecasts: Summary and Revisions from March 2025 Projections
| | 2023 | 2024 | 2025f | 2026f | 2027f |
|---|
Constant Prices | | | | | |
| Modified Domestic Demand | 2.6 | 2.7 | 2.0 | 2.1 | 2.2 |
| Gross Domestic Product | -5.5 | 1.2 | 9.7 | 2.7 | 5.6 |
| Total Employment | 3.4 | 2.7 | 2.1 | 1.9 | 1.8 |
| Unemployment Rate | 4.3 | 4.3 | 4.5 | 4.8 | 4.9 |
| Harmonised Index of Consumer Prices (HICP) | 5.2 | 1.3 | 1.9 | 1.8 | 1.7 |
| HICP Excluding Food and Energy (Core HICP) | 4.4 | 2.2 | 1.9 | 1.8 | 1.7 |
Revisions from previous Quarterly Bulletin, p.p | | | | | |
| Modified Domestic Demand | - | - | -0.6 | -0.4 | -0.0 |
| Gross Domestic Product | - | - | +5.7 | -1.3 | +1.8 |
| HICP | - | - | -0.3 | -0.3 | +0.3 |
| Core HICP | - | - | 0.0 | 0.0 | +0.2 |
MDD forecast to grow over the medium-term though the balance of risks is severely tilted to the downside given global economic tensions and high uncertainty
Figure 5: Contributions to annual change in MDD
Source: CSO, Author’s Calculations. Chart data in accessible format. (CSV 0.55KB)
Headline inflation is projected to remain at just below 2 per cent in 2025, with services remaining the primary source of upward pressure
Figure 6: Contributions to annual change in headline inflation
Source: CSO and Central Bank of Ireland. Chart data in accessible format. (CSV 0.53KB)
Forecast Detail
External Environment
The global economy continues to be characterised by a high level of trade-related uncertainty, which is having a negative impact on consumer and business sentiment. The assumptions for the international economy underpinning the central projections in this Bulletin have been revised downwards since March. US trade policy remains largely unpredictable, with a wide range of potential outcomes arising. Many entail a significant increase in tariffs on most imports to the US, leading to a fall in demand for imported goods, a slowing down of global growth, and an increase in inflation in the US, including through intermediate inputs and supply-chain channels. In contrast to the strong growth that arose throughout 2024, the US economy registered a small contraction in Q1 2025. While this effect is likely temporary, with a partial reversal expected in the coming quarters, forecasts for the US economy for 2025 have been revised sharply downwards. US trade policy and associated uncertainty have resulted in declines in consumer and business sentiment worldwide, which might eventually translate into reduced consumption and investment. Financial markets have been characterised by high levels of volatility and potential segments, including in long-dated US and Japanese government bonds, have become focal points in markets.
Tariffs threaten a slowdown in economic activity. Most economies, but in particular those with large trade flows with the US, such as Canada, Mexico, the euro area, China and Japan, are facing potential reductions in exports to the US as a result of tariffs. Such a development would generate a marked slowdown in their respective economies and in the global economy in general, with the uncertainty itself already showing some signs of reducing investment. However, the impact is highly uncertain and hinges on whether each country can reach a final trade deal with the US, and on what terms. The extent of any retaliatory measures, as well as exchange rate behaviour, would also influence inflationary pressures and the attendant response of monetary policy.
The June Eurosystem staff macroeconomic projections for the euro area foresee GDP growth of 0.9 per cent, 1.1 per cent and 1.3 per cent in 2025, 2026 and 2027, respectively. These are almost unchanged compared to the March projections despite increased risks, due in part to a large front-loading of exports in the first quarter of 2025, and the forecasted effects of trade tensions and increased defence spending broadly offsetting each other afterwards. Euro area headline inflation is expected to be at the ECB target in the medium run, with projections for HICP inflation of 2.0, 1.6 and 2.0 per cent from 2025 to 2027. These forecasts were revised significantly downwards due to lower energy prices and an appreciation of the euro. The ECB Governing Council (GC) decided in June to reduce the three key ECB interest rates by 25 basis points, with the deposit facility rate now standing at 2.0 per cent, half the level it was at the end of the hiking cycle in 2023. The GC sees the disinflationary process as well on track for inflation to stabilise around the 2 per cent target in the medium term, but it will maintain a data-dependent and meeting-by-meeting approach for upcoming decisions. Overall weighted external demand for Irish exports is projected to grow by an average of 2.1 per cent per year between 2025 and 2027, a 0.8 p.p. downward revision from the March 2025 projections (Table 2). Growth in foreign demand over the forecast horizon is below its long-run average, reflecting the impact of recent increases in policy uncertainty and higher tariffs that are embedded in the global assumptions.
Table 2: International Economic Outlook
| | 2023 | 2024 | 2025f | 2026f | 2027f |
|---|
| World | 3.5 | 3.3 | 2.8 | 3.0 | 3.2 |
| Euro area (June 2025 - baseline) | 0.4 | 0.8 | 0.9 | 1.1 | 1.3 |
| US | 2.9 | 2.8 | 1.8 | 1.7 | 2.0 |
| UK | 0.4 | 1.1 | 1.1 | 1.4 | 1.5 |
| Japan | 1.5 | 0.1 | 0.6 | 0.6 | 0.6 |
| China | 5.4 | 5.0 | 4.0 | 4.0 | 4.2 |
| Emerging economies | 4.7 | 4.3 | 3.7 | 3.9 | 4.2 |
| Weighted global demand for Irish exports | -0.8 | 2.3 | 2.5 | 1.1 | 2.8 |
Notes: Table shows projections for annual GDP growth for major global economies. Forecasts for the euro area and for weighted global demand for Irish exports are from the Eurosystem Staff Macroeconomic Projections, June 2025. Forecasts for the remainder are from the IMF April 2025 WEO.
Economic Activity
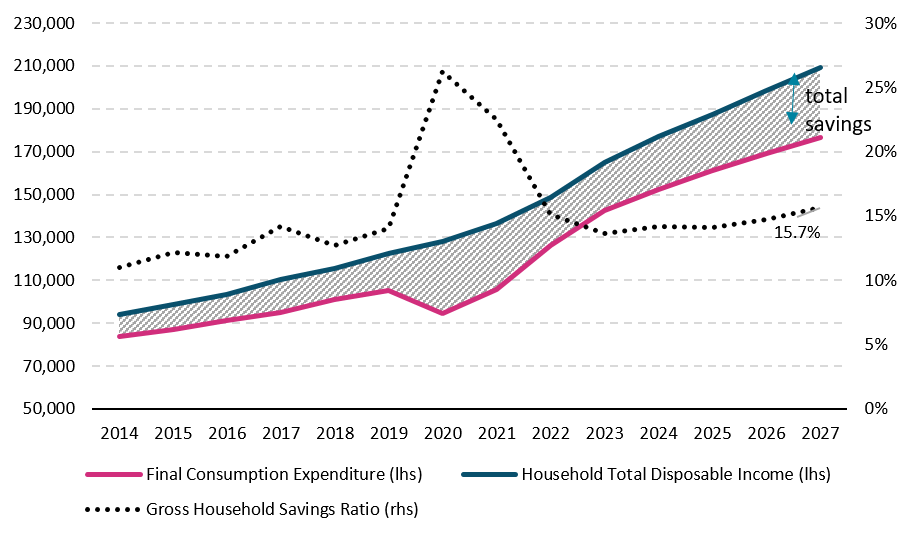
Consumption growth is expected to remain resilient despite heightened global economic uncertainty, growing at 2.6 per cent in 2025, a modest downward revision relative to the previous Bulletin. Rising real wages, alongside stable employment conditions and a supportive fiscal stance, should sustain real household incomes and therefore consumption. However, the pace of growth is expected to moderate gradually over the forecast horizon as real income gains slow with consumption growth forecast to ease to 1.9 per cent in 2027. The path of household savings is revised downward from QB1 (March 2025), primarily based on realised data, but it is still expected to rise gradually over the coming years from 14.1 per cent in 2025 to 15.7 per cent in 2027. Consumer sentiment declined sharply in April (Figure 8), while survey evidence suggests that households expect general economic conditions to worsen over the coming 12 months, potentially leading to a rise in precautionary savings. However, the increase in the savings ratio is primarily related to ongoing structural trends (Boyd, Byrne and McIndoe Calder, 2025 (PDF 1.05MB)).
Consumption projected to continue growing modestly, with a reduction in projected household income in part reflected in a lower household savings rate
Figure 7: Household Consumption and Disposable Income (in millions), and Savings Ratio
Source: CSO. Chart data in accessible format. (CSV 1.18KB)
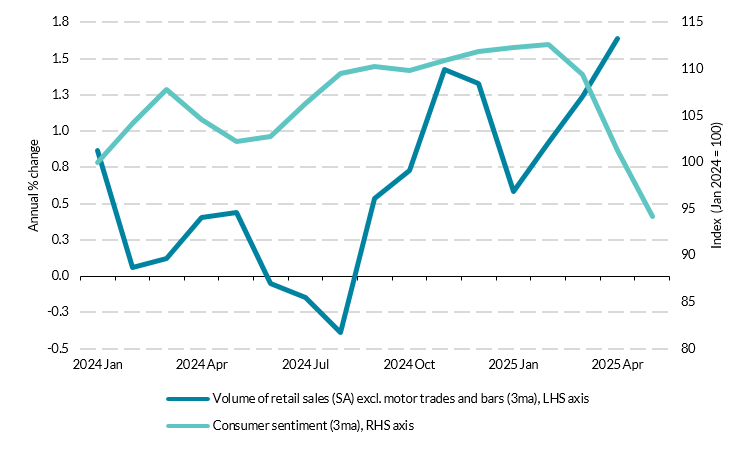
The 2025 Q1 consumption outturn was broadly in line with what was expected at the time of the last Bulletin. Headline retail sales grew by just over half a per cent in the first quarter compared with the first quarter of 2024, with core sales (excluding motor trades) up by 0.6 per cent in the same period. Other high frequency indicators also implied stable momentum in the first quarter of 2025. Combined card payments and cash withdrawals averaged 8 per cent higher in the first quarter than a year previously in value terms. Consumer sentiment remains subdued however, dipping sharply in April and only recovering slightly in May reflecting heightened uncertainty.
Retail sales rise up to April but potential headwind from sharp decline in consumer sentiment
Figure 8: Consumer Sentiment and Retail Sales Index
Source: CSO and Credit Union Consumer Sentiment Index. Chart data in accessible format. (CSV 1.9KB)
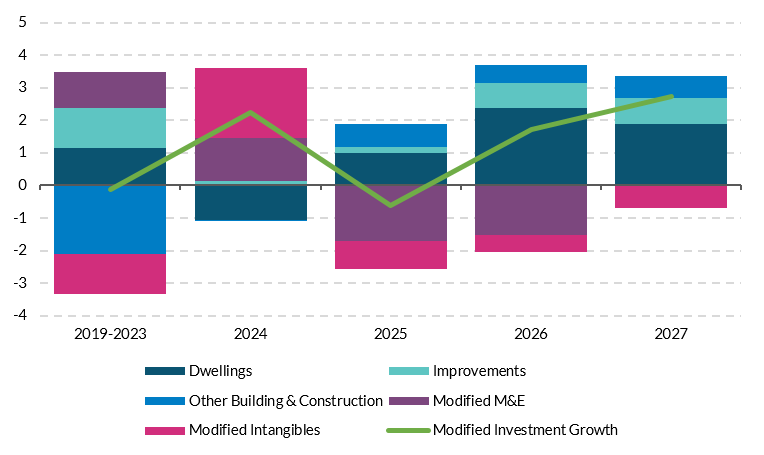
The outlook for modified investment is significantly weaker over the forecast horizon than in the previous Bulletin, in part reflecting even higher policy uncertainty. Projections for modified investment have been revised downward by 1.5 percentage points, to 1.3 per cent on average from 2025 to 2027. The main driver of the revision is the impact of uncertainty – which hit historic highs in April 2025 – on modified M&E (see Box 1 from 2025 Q1 Bulletin for more details of how the impact of uncertainty is incorporated into the forecast). Machinery and equipment investment is historically quite volatile. For example, following a rapid pandemic-related decline in 2020, it recovered to its pre-COVID levels in 2022. Modified M&E investment is dominated by foreign-owned multinational firms and is therefore the most likely channel through which the historically high level of uncertainty will manifest. Consistent with this, the European Commission’s Industry Survey pointed to a substantial decline in production expectations in April, down from a reading of 48.2 in March to 16.8. Dwellings and Improvements are expected to make the largest positive contributions to modified investment growth over the forecast period, though these are revised down from the previous Bulletin in light lower than anticipated dwellings and commencement data for Q1 2025.The outlook for headline investment in 2025 is revised up relative to the previous Bulletin, with an increase of 25.6 per cent expected, owing to a significant increase in intellectual property related imports in Q1 2025. The outlook for headline investment in 2026 and 2027 at 1.1 and 1.6 per cent is broadly unchanged from the previous Bulletin.
Significant downward revision to modified investment amid high global uncertainty
Figure 9: Contributions to Modified Investment growth (annual, per cent)
Source: CSO and Central Bank of Ireland. Chart data in accessible format.
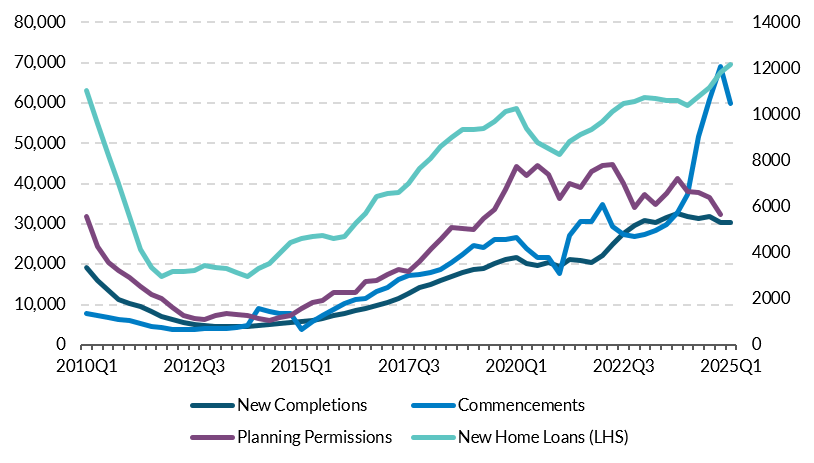
The impact of global uncertainty on investment is starting to appear in a wide array of indicators, while overall housing investment is still forecast to remain below required levels based on population growth and household formation. Survey data in April and May point to a slowdown in firms’ expectations of future demand. The manufacturing PMI for new export orders moved into negative territory (49.7) in April, likely reflecting uncertainties over tariffs. The services PMI for new business also slowed substantially in April, registering a very marginal expansion of 50.6. Imports of machinery and equipment (excluding aircraft) increased by just 1.9 per cent in Q1 2025 year-on-year, a substantial decline in the double-digit rates of increase in 2024. While there was a large increase in industrial production in the modern sector in Q1 2025 (reflecting in part the frontloading of exports in the pharmaceutical sector), industrial production in the traditional sector declined by 3.5 per cent in Q1 2025 compared to the previous quarter. Loans to non-financial corporations declined in Q1 2025, down from €504 million in Q4 2025 to €242 million in Q1 2025. Gross new lending to SMEs stood at €1.2 billion in Q4 2024, unchanged from the same quarter the previous year. Of note is that estimated repayments by SMEs stood at €1.7 billion in Q4 2024, representing the largest level of quarterly repayments since Q1 2020; this could signal a preference by SMEs to repay loans rather than invest given the elevated level of uncertainty. The latest Bank Lending Survey reported no change in firms demand for loans in Q1 2025, despite firms reporting expectations in the previous Survey that demand would increase during the quarter. Housing completions are forecast to increase to 32,500, 37,500 and 41,500 in 2025, 2026 and 2027, respectively. This represents a downward revision compared to the forecast in March 2025. Underpinning this downward revision is that dwelling completions came in below expectations in Q1 2025, while commencements dropped sharply to just 2,981 units from 17,017 in Q4 2024. This latter development reflects the largely anticipated effect of the ending of the development levy and Irish Water rebate. The housing projections are subject to considerable uncertainty given current bottlenecks in housing supply and infrastructure. The forecasts assume some improvement over the forecast horizon on the factors currently constraining higher housing output. Low productivity in the construction sector continues to be an important constraint on housing supply (see Box 1). The projections imply that the overall ratio of modified investment to national income (GNI*) will stagnate at around 17 per cent by the end of the forecast horizon, well below its long-run (1995 to 2023) average of 22.1 per cent.
Slowdown in Completions and drop off in Commencements in 2025 Q1, reflecting anticipated effects of ending development levy and Irish Water rebate
Figure 10: Annualised housing units/€ millions
Source: CSO and Central Bank of Ireland. Chart data in accessible format. (CSV 2.38KB)
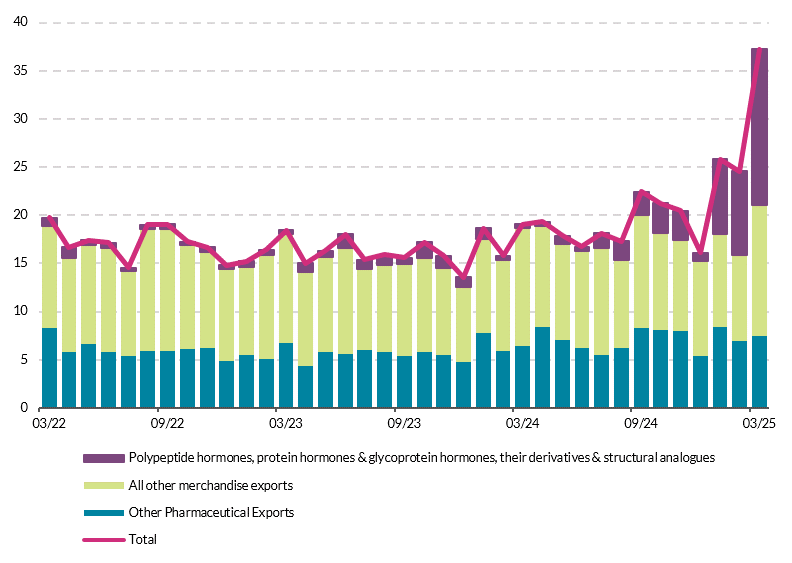
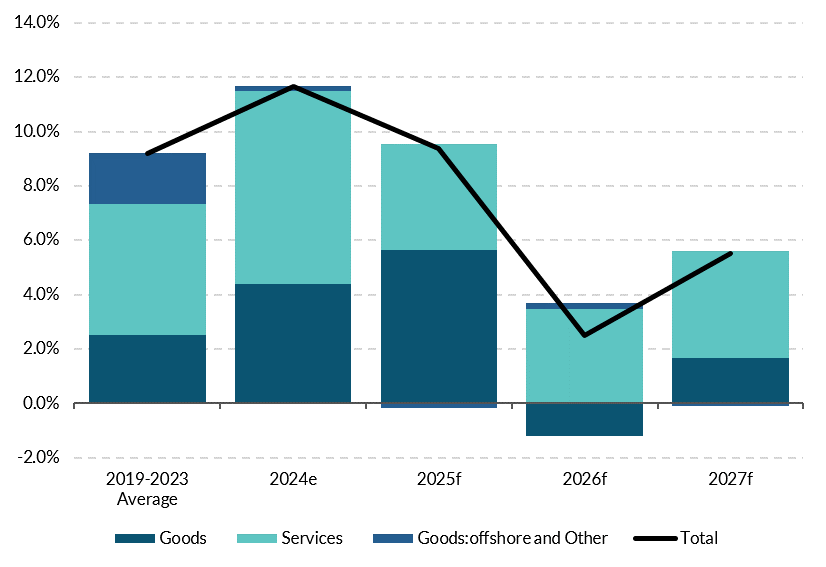
The outlook for exports is subject to considerable uncertainty but growth is expected from 2025 to 2027. The outlook for exports is affected by two developments. First, the baseline forecast assumes the introduction by the US authorities of a 20 per cent tariff on some Irish goods exports to the US from July 2025, in-line with announced US policy. Economic policy uncertainty is assumed to gradually decline over the forecast horizon to 2018 levels. Such tariffs and uncertainty would weigh on Irish goods export performance. Secondly, the initial months of 2025 saw a sharp increase in merchandise exports, up 64 per cent in value terms year-on-year in Q1, almost entirely driven by exports to the US. While this mostly reflects a general frontloading of exports ahead of anticipated tariffs, the surge is concentrated in a single product category: ingredients used in weight-loss and diabetes medicines. Against this background, the baseline forecast assumes a symmetrical fall in exports in Q3 to the rise in Q1, before returning to the trend seen in the second half of 2024 throughout 2026 and 2027. On the services side, ICT remains the main driver of export growth, although growth in this component is expected to moderate slightly over the forecast horizon. Overall imports are projected to grow by 7.3 per cent in 2025, easing to an average of 2.8 per cent in 2026–27, consistent with the path of final demand and ongoing supply chain normalisation.
Majority of merchandise export growth in first three months driven by one product category
Figure 11: Value of merchandise exports, € billion
Source: Eurostat and central bank calculations. Chart data in accessible format. (CSV 2.34KB)
Strong growth in pharmaceutical exports forecast to drive export growth in 2025, with services exports expected to dominate thereafter
Figure 12: Export growth (per cent)
Source: CSO and Central Bank Calculations. Chart data in accessible format. (CSV 0.74KB)
The modified balance of payment position is projected to remain in surplus. The modified current account balance (CA*) is expected to narrow slightly in 2025, reflecting a projected moderation in the net trade contribution compared with 2024 and to remain in surplus out to 2027. The surplus in large part is due to an expected continued positive merchandise trade balance. Primary income outflows are forecast to increase over the forecast horizon, aligned with MNE profits generated from export growth. However the outlook for MNE profits is uncertain which means a wide array of outcomes are possible for the CA* balance.
Inflation
The central forecast is for a continued easing of headline HICP, broadly unchanged from the previous Bulletin in March. Headline inflation is projected to rise to 1.9 per cent in 2025 before declining to 1.8 in 2026, and further easing to 1.7 in 2027 (Table 3). These projections contain a small downward revision to 2025 with a small upward revision in the medium-term, relative to the projections in QB1. The revisions are primarily driven by lower energy price assumptions, which are somewhat offset in 2027 by the projection for slightly more persistent services inflation. Food price inflation is expected to ease over the forecast horizon, from 3.5 per cent in 2025 to 1.4 per cent by 2027.
A key driver of the inflation projections are commodity price assumptions, which have been revised downward compared with the last Bulletin. Among the energy assumptions, gas prices registered the most significant downward revision (24 per cent for 2025) compared to previous assumptions used for the March 2025 projections. Electricity and oil price assumptions were revised down by 18 and 11 per cent respectively for 2025. Weaker global demand and increased oil production targets have prompted a downward revision across all energy-related technical assumptions. The effects of these updated assumptions are a downward revision to headline inflation over the forecast horizon. Additionally, the euro exchange rates against the US Dollar and Pound Sterling are assumed to be higher compared with the last Bulletin.
Table 3: Inflation Projections
| | 2024 | 2025 | 2026 | 2027 |
|---|
| HICP | 1.3 | 1.9 | 1.8 | 1.7 |
| Goods | -1.5 | 0.6 | 0.2 | 0 |
| Energy | -7.8 | -0.7 | 1.5 | 1.9 |
| Food | 3.0 | 3.5 | 2.0 | 1.4 |
| Non-Energy Industrial Goods | -1.9 | -1.0 | -1.6 | -1.8 |
| Services | 4.1 | 3.0 | 3.2 | 3.2 |
| HICP ex Energy | 2.4 | 2.2 | 1.8 | 1.7 |
| HICP ex Food & Energy (Core) | 2.3 | 1.9 | 1.8 | 1.7 |
Source: CSO, Central Bank of Ireland
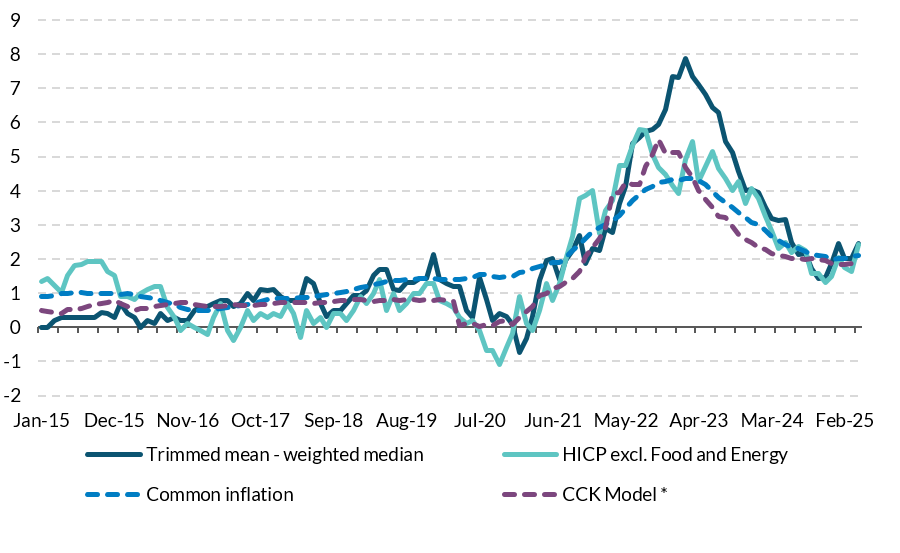
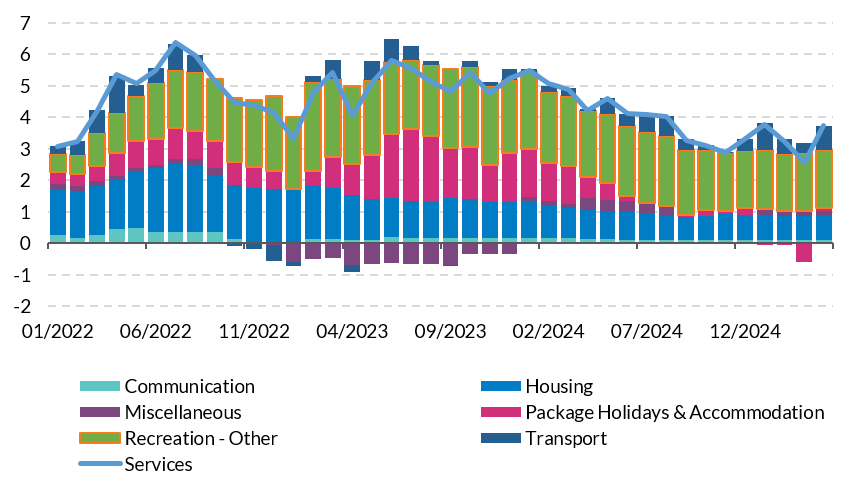
Core inflation shows signs of stabilising below 2 per cent, despite an upside surprise in April. Most measures of underlying inflation are now falling below 2 per cent, albeit above the pre-pandemic level (Figure 13). Consumer price data up to May 2025 indicates that headline inflation has fallen slightly below 2 per cent. Services inflation also remained relatively stable through early 2025 but showed a noticeable increase in April, largely driven by a reversal in package holidays and accommodation, as well as a strong pick up in transport-related services (Figure 14). Within transport, the majority of this effect came from a surge in airfares, which contain a strong seasonal component and spiked in April. Consumers’ near-term inflation expectations rose to 4.6 per cent relative to the previous Bulletin (2.9 per cent), while perceived inflation continues to decline, but remains above realised HICP at 4.2 per cent as recorded in the Irish results of the most recent ECB Consumer Expectations Survey (CES).
Underlying measures of inflation stabilising close to 2 per cent
Figure 13: Underlying measures of inflation (year-on-year percentage change)
Source: Eurostat, Central Bank of Ireland calculations. Chart data in accessible format. (CSV 6.54KB)
Note: CCK Model refers to the approach put forward by Chan, Clarke and Koop (2018): “A new model of inflation, trend inflation, and long‐run inflation expectations”.
Services inflation is hovering around 3 per cent, with package holidays and accommodation surprising to the downside in March and transport to the upside in April
Figure 14: Contributions to services inflation (year-on-year per cent change)
Source: CSO and Central Bank of Ireland. Chart data in accessible format. (CSV 4.09KB)
Labour Market and Earnings
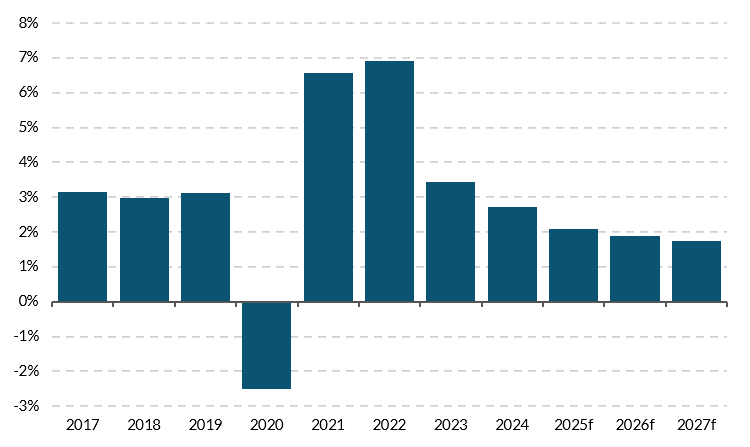
Against a more uncertain economic outlook, employment growth is forecast to slow down but to remain positive. Following a sharp rise in employment since 2021, lower employment growth is expected over the medium term, with a rate of increase of 2.1 per cent projected for 2025, followed by growth of 1.9 per cent and 1.8 per cent in 2026 and 2027, respectively (Figure 15). These forecasts are revised down slightly from those presented in QB1 2025, reflecting the higher level of economic uncertainty. Employment is still forecast to grow based on the relatively benign prospects for domestic demand but uncertainty may lead firms to adopt a more cautious approach to increased investment and production and, in turn, associated job creation.
Employment growth is projected to ease over the forecast horizon
Figure 15: Employment growth (per cent)
Source: CSO. Chart data in accessible format. (CSV 0.26KB)
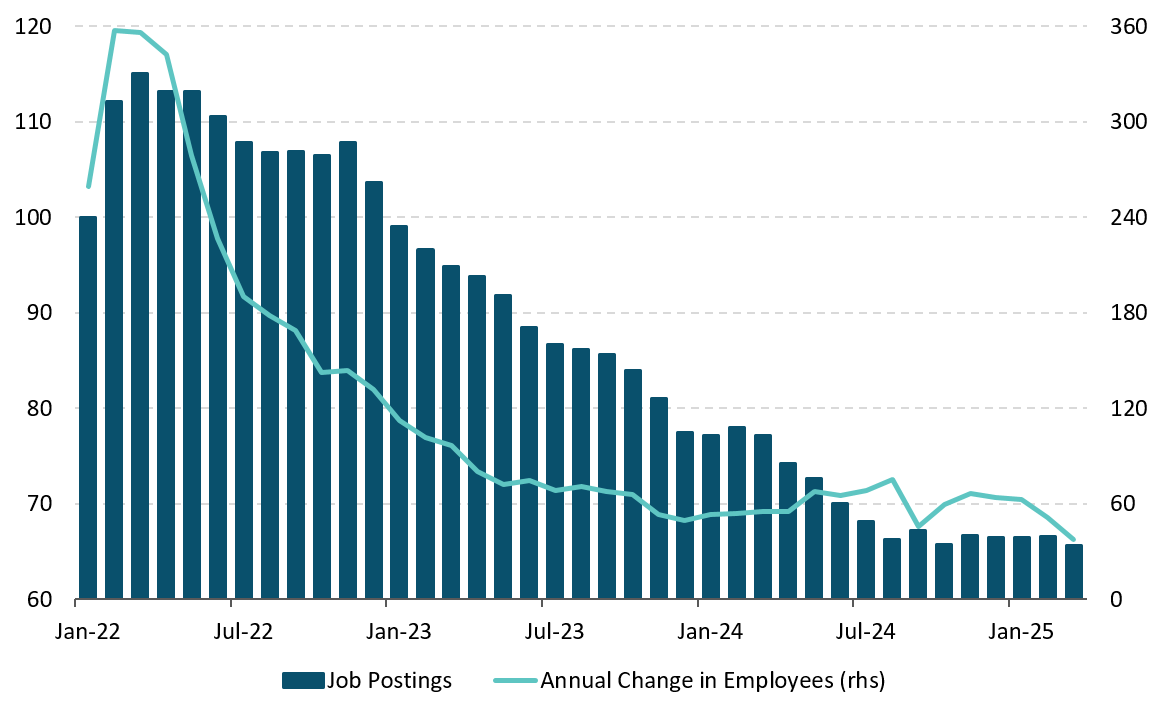
Labour market conditions remain tight despite a recent uptick in unemployment. Labour Force Survey (LFS) data for Q1 2025 indicate year-on-year growth in employment of 3.3 per cent (a rise in the number at work of 89,900). This increase is attributable to both continued high net inward migration and further growth in female labour force participation. Education, Health and Public Admin sectors accounted for a combined 1.5pp of the 3.3 per cent growth in employment in Q1 2025, maintaining their strong contribution to employment growth as observed in recent years. While labour demand has moderated in recent months, as indicated by Indeed job postings data (Figure 16), labour market conditions are relatively tight with the unemployment rate remaining below 5 per cent and the long-term unemployment rate falling to a record low of 1 per cent in Q1 2025. The unemployment rate increased from 4 per cent to 4.3 per cent over the quarter to Q1 2025. Further gradual increases are projected over the forecast horizon as heightened global uncertainty is projected to lead to a slower rate of job creation (Table 4). It is possible that firms could react to the uncertainty surrounding tariffs by adjusting working hours rather than laying off staff in order to avoid rehiring costs, putting downward pressure on the unemployment rate. Average hours worked already remain below pre-pandemic levels across all NACE sectors. Such labour hoarding behaviour might suit firms with the financial capacity to absorb wage costs. Based on employment permits data, some sectors such as Health continue to show resilient labour demand. A rising labour force participation rate is supporting labour supply, which increased by 0.8pp to 65.8 per cent year-on-year in Q1 2025. This mainly reflected a higher female participation rate, with some further gains expected over the forecast horizon. (Box 3 considers the contribution of human capital accumulation to economic growth.)
Slowing labour market is evident in both job postings and annual change in employee levels
Figure 16: Job postings (Index, January 2022=100) Annual change in employee levels (000s)
Source: Indeed and CSO. Chart data in accessible format. (CSV 1.31KB)
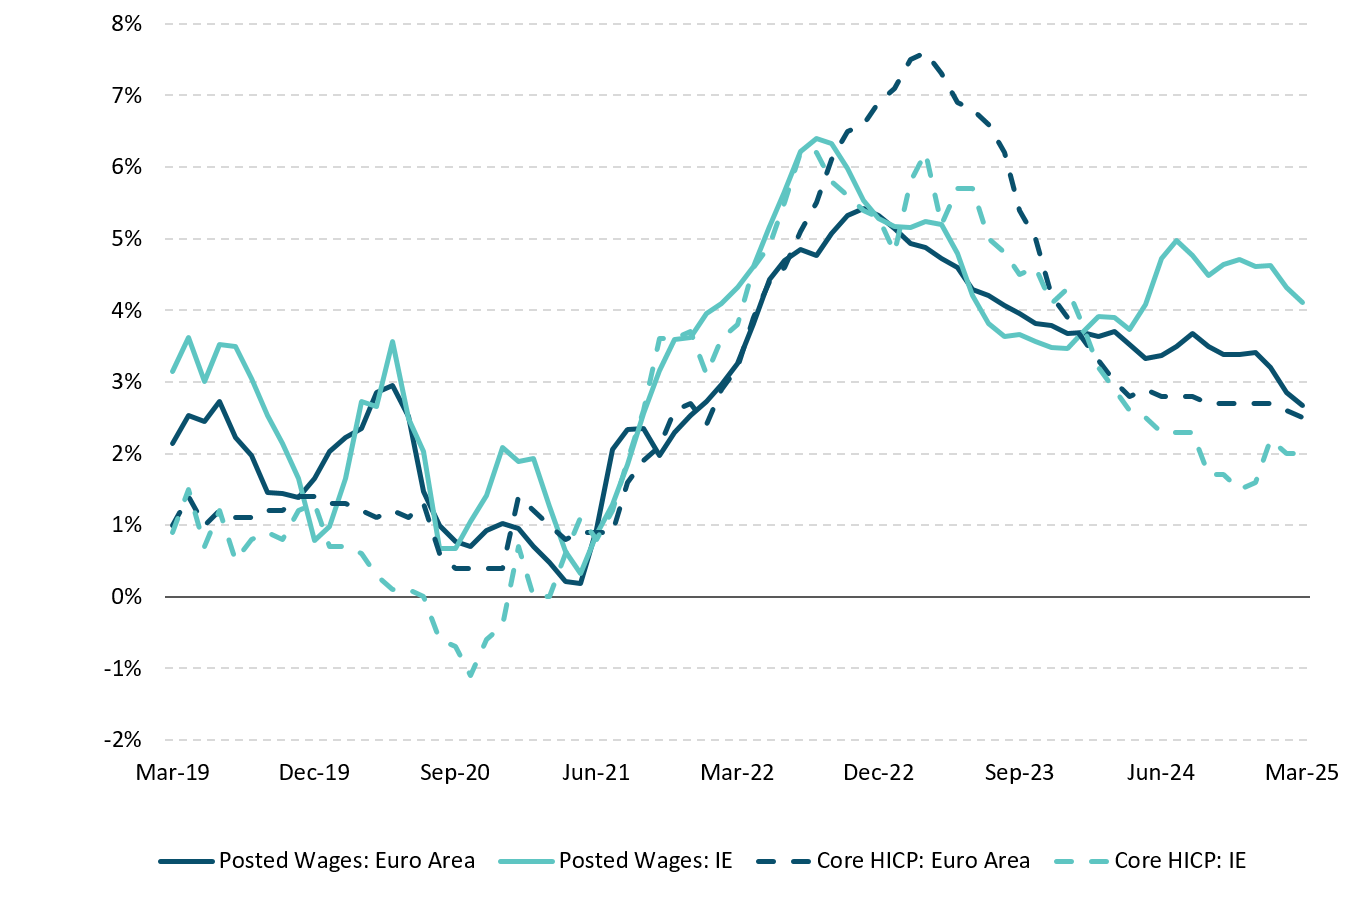
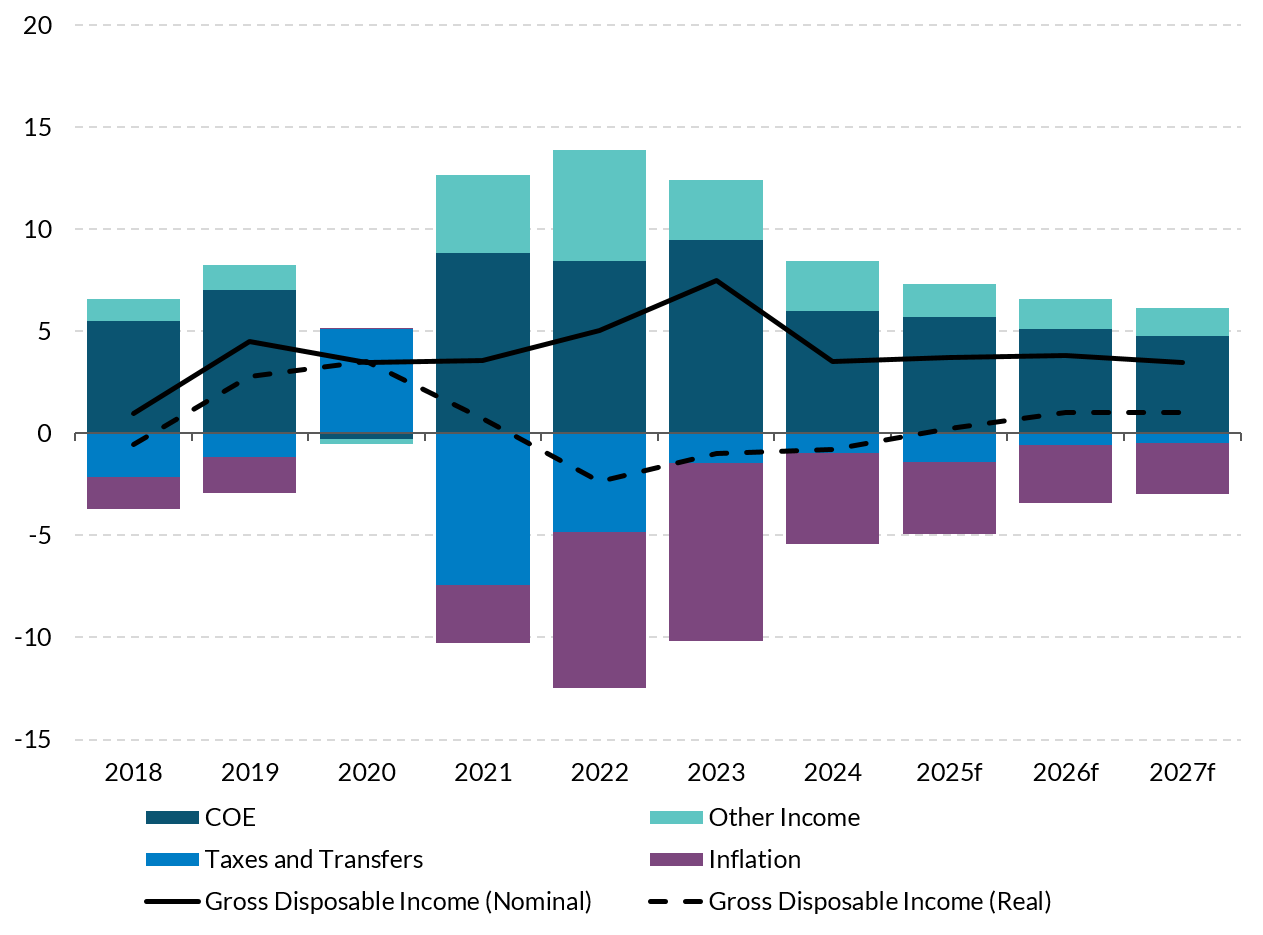
Increases in real wages and disposable income are expected to support consumption growth over the forecast horizon. According to the Quarterly National Accounts, overall employee compensation rose by 6.7 per cent in nominal terms 2024, which, combined with the latest data on employment and inflation, led to a decline of 0.8 per cent in real Compensation per Employee (CPE) last year. However, this is subject to revision upon the release of the Annual National Accounts in Summer 2025, which, based on previous years’ experience, may see upward revisions to historic compensation data. CPE is expected to rise by 3.8 per cent on average in nominal terms from 2025 to 2027. The possibility of weaker labour demand poses a downside risk to wage projections. In line with developments in other euro area countries, Indeed job postings data for April 2025 are lower (down 15 per cent year on year) but remain above the pre-pandemic baseline. Continued growth in labour demand in public-facing economic sectors may offset easing demand elsewhere. CSO EHECS vacancy data indicate that the public-facing sectors of Education, Health and Public admin accounted for a combined 43.8 per cent of 29,700 job vacancies in Q1 2025. In line with broader euro area developments and falling inflation, posted wages in Ireland recorded year-on-year growth of 4.2 per cent in April 2025, down slightly from the start of the year (Figure 17). Growth in real gross disposable income per household is projected to turn positive in 2025 and increase gradually out to 2027, supported by increases in wage income and moderating inflation (Figure 18).
Posted wages in Ireland are beginning to soften in line with core inflation developments
Figure 17: Indeed Jobs Postings and HICP inflation, year-on-year growth (per cent)
Source: Eurostat and Indeed. Chart data in accessible format. (CSV 3.21KB)
Real household disposable income to remain positive over forecast horizon as inflation eases
Figure 18: Contributions to annual growth in real disposable income per household, per cent
Source: CSO and Central Bank of Ireland. Chart data in accessible format. (CSV 1.02KB)
Table 4: Labour Market Forecasts
| 2023 | 2024 | 2025f | 2026f | 2027f |
|---|
| Employment (000s) | 2,685 | 2,757 | 2,817 | 2,871 | 2,922 |
| % change | 3.4% | 2.7% | 2.1% | 1.9% | 1.8% |
| Labour Force (000s) | 2,805 | 2,880 | 2,951 | 3,017 | 3,073 |
| % change | 3.3% | 2.7% | 2.4% | 2.2% | 1.9% |
| Participation Rate (% of Working Age Population) | 65.5% | 65.8% | 66.0% | 66.2% | 66.3% |
| Unemployment (000s) | 120 | 123 | 134 | 145 | 151 |
| Unemployment (% of Labour Force) | 4.3% | 4.3% | 4.6% | 4.8% | 4.9% |
Source: CSO, Central Bank of Ireland.
Public Finances
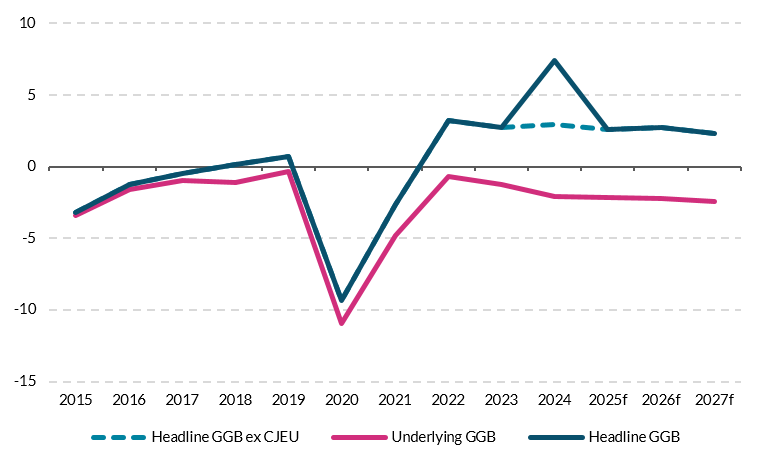
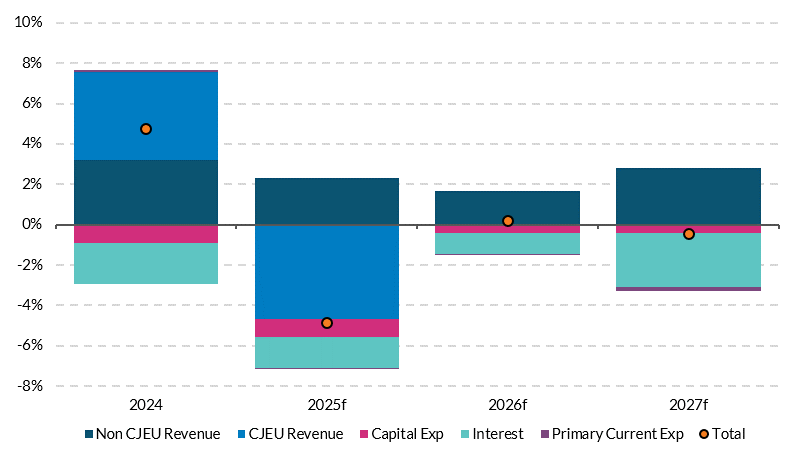
The underlying budget balance is forecast to remain in deficit over the projection horizon with the headline balance expected to continue benefitting from excess corporation tax (CT). The underlying general government balance (GGB) – which excludes estimates of excess CT and revenue related to the Court of Justice of the EU’s (CJEU) ruling in the Apple state aid case – is estimated to have recorded a deficit of -2.1 per cent of GNI* in 2024 (Figure 19). Underlying deficits are projected to continue in the medium term, deteriorating to 2.4 per cent of GNI* in 2027 (Table 5). Although the introduction of BEPS Pillar Two next year is expected to provide a boost to CT, underlying revenue growth is forecast to weaken over the medium term as domestic activity, employment and nominal wage growth moderate. While the pace of growth in government expenditure is also projected to decline in the coming years, it is still expected to be larger than the increase in underlying revenue (5.9 per cent compared to 5.3 per cent in 2027). This spending outlook assumes no further cost of living support measures being introduced and that growth in capital expenditure – while remaining high by historical comparison – moderates from an average rate of 17.9 per cent for 2022-24 to 11.2 per cent between 2025 and 2027. The headline GGB recorded a stronger than expected outturn of €23.2bn last year, boosted not only by the CJEU ruling but also by a very strong revenue performance in other areas (Figure 20). Headline surpluses are expected to moderate over the projection horizon to 2.3 per cent of GNI* in 2027.
Underlying GGB projected to remain in deficit over the medium term
Figure 19: General Government balance, per cent of GNI*
Source: CSO, Central Bank of Ireland. Chart data in accessible format. (CSV 0.73KB)
Note: Headline GGB ex CJEU excludes receipts from the Court of Justice of EU’s (CJEU) ruling on the Apple State aid case. The underlying GGB excludes Central Bank estimates of excess corporation tax and receipts from the CJEU ruling.
CJEU ruling on Apple State aid case has significant temporary impact on headline GGB in 2024
Figure 20: Decomposition of the change in the General Government balance, per cent of GNI*
Source: Central Bank of Ireland. Chart data in accessible format. (CSV 0.51KB)
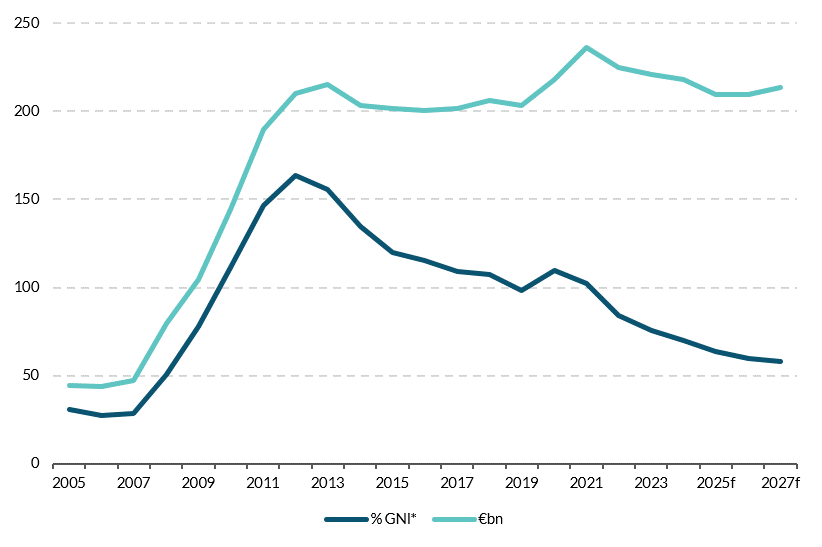
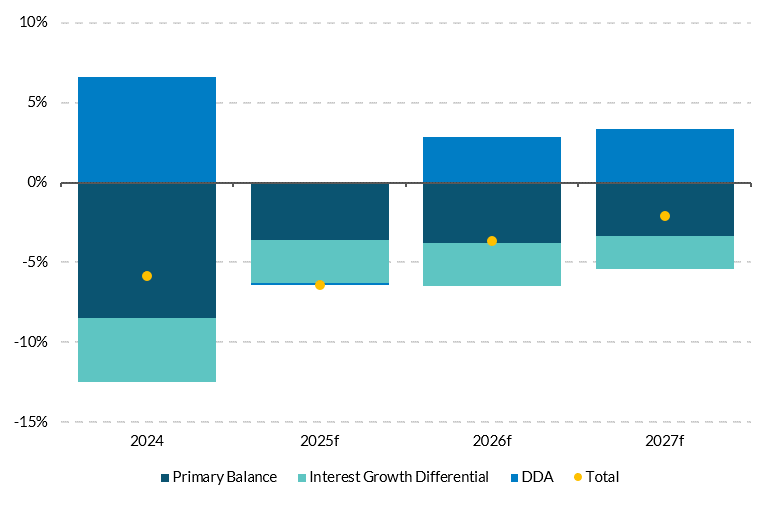
The General Government debt (GGD)-to-GNI* ratio is expected to continue to decline in the years ahead. The GGD ratio is projected to continue its post-pandemic decline, to a value of 57.9 per cent by end-2027, a decrease of around 12 percentage points from its 2024 level (Figure 21). The falling debt ratio is projected to benefit both from large primary surplus projections (averaging 3.6 per cent of GNI* over 2025-2027) and a continuing favourable interest rate-growth rate differential (Figure 22). The negative differential arises from projected nominal GNI* growth, averaging 5.8 per cent per annum, above the 1.7 per cent projected average effective rate on government debt. The National Treasury Management Agency (NTMA) plans to issue between €6bn and €10bn in bonds this year, with around half of the Government’s funding needs expected to be financed by running down the large cash and other liquid balances at its disposal (which stood at €34bn at end-April). The NTMA raised a further €1.25bn in May through the auction of a 2.6 per cent Treasury bond maturing in 2034. This brings the value of total issuances in 2025 to €5.25bn.
Debt ratio projected to fall to below 60 per cent in 2027
Figure 21: General government debt Per cent of GNI*, € billion
Source: CSO, Central Bank of Ireland. Chart data in accessible format. (CSV 0.76KB)
Budget surpluses and strong nominal growth continue to drive the reduction in public debt ratio
Figure 22: Decomposition of the forecast change in GGD ratio Per cent of GNI
Source: Central Bank of Ireland. Chart data in accessible format. (CSV 0.41KB)
Notes: DDA is the deficit-debt adjustment. It reflects factors that impact the stock of government debt but have no impact on the general government balance.
Table 5: Key Fiscal Indicators, 2023-2027
| | 2023 | 2024(e) | 2025(f) | 2026(f) | 2027(f) |
|---|
| GG Balance (€bn) | 7.9 | 23.2 | 8.5 | 9.7 | 8.5 |
| GG Balance (% GNI*) | 2.7 | 7.4 | 2.6 | 2.8 | 2.3 |
| GG Balance (% GDP) | 1.5 | 4.3 | 1.4 | 1.5 | 1.2 |
| GG Debt (€bn) | 220.7 | 218.2 | 209.3 | 209.5 | 213.4 |
| GG Debt (% GNI*) | 75.9 | 70.0 | 63.6 | 60.0 | 57.9 |
| GG Debt (% GDP) | 43.3 | 40.9 | 34.3 | 32.0 | 30.1 |
| Excess CT (€bn) | 11.6 | 15.7 | 15.7 | 17.3 | 17.3 |
| Underlying GGB (€bn) | -3.7 | -6.6 | -7.2 | -7.7 | -8.9 |
| Underlying GGB (% GNI*) | -1.3 | -2.1 | -2.2 | -2.2 | -2.4 |
Source: Central Bank of Ireland Projections.
Note: Underlying GGB excludes estimates of excess CT and receipts from the Apple state aid case;
(e) is estimate and (f) is forecast.
Balance of Risks to the Outlook
Downside risks overshadow the outlook for economic growth amid widespread uncertainty and the threat of escalating geoeconomic fragmentation. The openness of the Irish economy and the prominent role of FDI and multinational firms mean that changes in global economic activity transmit directly to Ireland. In particular, the extent and nature of the linkages to the US mean that trade, tax or other economic policy changes there could have negative implications for the public finances, the labour market, and the economy more generally. The baseline forecasts assume that US tariffs on the EU increase from 10 per cent currently to the originally announced level of 20 per cent from Q3 2025, once the US administration’s 90-day pause on its reciprocal tariffs ends. Pharmaceuticals and certain ICT products are assumed to remain excluded from tariffs and uncertainty is assumed to decline gradually to 2018 average levels (Table 6). This combination of assumptions already present a more negative scenario than applied to the baseline forecasts in our March 2025 Quarterly Bulletin, prompting downward revisions to the growth outlook. At present, trade negotiations are continuing between the US and the EU as well as between the US and other trading partners. The ultimate outcome of these negotiations and, in particular, the level of tariffs that are likely to apply from July when the current pause period expires remains unknown. Reflecting this uncertainty, this Bulletin provides projections for headline economic activity in an adverse scenario.
Higher tariffs, more persistent uncertainty and tighter financial conditions would result in weaker economic activity than in the baseline. Compared to the baseline, the adverse scenario assumes that 20 per cent tariffs apply to all goods from Q3 2025 and that the EU retaliates with symmetric tariffs on the US. Uncertainty is assumed to be higher and more persistent, with tighter global financial conditions leading to higher lending rates than in the baseline (Table 6). Based on this set of assumptions, annual average MDD growth in the adverse scenario is projected to fall to 1.2 per cent from 2025 to 2027 compared to 2.1 per cent in the baseline. By 2027, the overall level of MDD in the adverse scenario would be 2.6 per cent lower than in the baseline, illustrating the significantly weaker path for economic activity in this case. The largest contribution to the weaker MDD outturn in the adverse scenario relative to the baseline comes from the more prolonged uncertainty and tighter financial conditions as households and firms constrain consumption and investment spending. The pace of growth in the adverse scenario is also weighed down by a larger negative effect on exports from higher effective tariffs which spills over to domestic activity. The same channels would also lead to a slower pace of growth in activity as measured by GDP (Figure 24). The adverse scenario is intended to illustrate the possible impact on the economy in one scenario where key assumptions underpinning the baseline forecast change in a more negative direction. It is important to note that a range of other outcomes – both more severe and more benign – could materialise. Boyd et al. (2025) estimate the impact on the public finances if the adverse scenario was also accompanied by a loss of excess CT and lower investment by multinational firms. In this case, a general government deficit of over 4 per cent of GNI* could emerge in the absence of corrective action, highlighting the potential negative effects of this scenario.
The tariff assumptions underpinning both the baseline and adverse scenarios are largely without historical precedent. Consequently, the estimates from the macroeconomic models used to inform the scenarios may not fully capture all the channels through which higher tariffs could affect the Irish economy, or the nature of those affects precisely. In particular, the reorientation of supply chains that could lead to fundamental trade disruption is a feature not currently considered in these modelling exercises. Alongside this, the responsiveness of businesses across the globe in terms of trade diversion arising from diverse tariff rates may be different than what is assumed, as may be the responsiveness of exchange rates. As further evidence emerges as to the realised impact of tariffs through these channels along with new research and modelling approaches, this will be used to update assessments of the economic impact.
Table 6: Assumptions underpinning the baseline forecast and adverse scenario
| | Baseline | Adverse |
|---|
| US-EU Tariffs | 20 per cent tariffs from Q3-2025. No EU retaliation. Pharma and certain ICT excluded. | 20 per cent tariffs from Q3-2025. Symmetric EU retaliation. All goods included. |
| US-China Tariffs | 34 per cent tariffs on China from Q3 2025. | 34 per cent tariffs on China from Q3 2025. |
| US-Rest of the World Tariffs | 10 per cent. | 10 per cent. |
| Uncertainty | Gradually declines to 2018 average. | Declines marginally from high levels in April 2025 but remains elevated to end-2027. |
| Financial Conditions | Standard technical assumptions in line with current market expectations. | Higher stress in global financial markets leading to increased funding costs for financial intermediaries and tighter credit conditions. |
Pace of growth in economic activity would slow significantly in an adverse scenario
Figure 23: MDD, annual % change
Source: Central Bank of Ireland. Chart data in accessible format. (CSV 0.12KB)
Figure 24: GDP, annual % change
Source: Central Bank of Ireland. Chart data in accessible format. (CSV 0.12KB)
Figure 25: HICP, annual % change
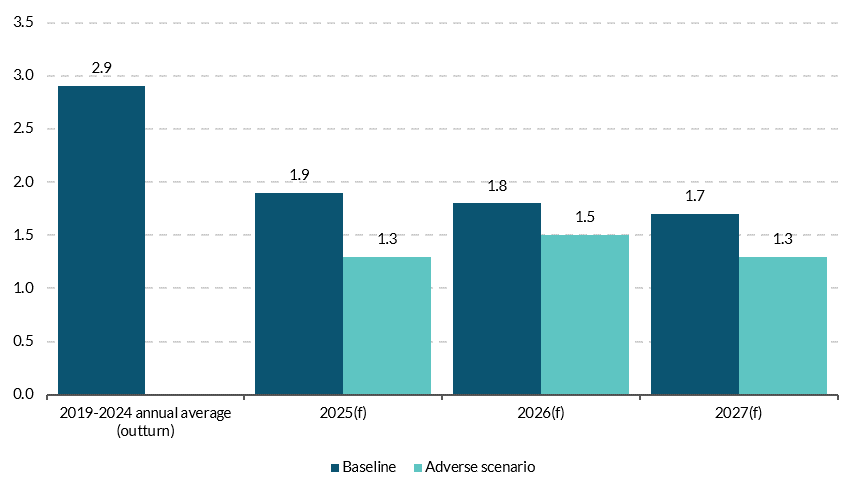
Source: Central Bank of Ireland. Chart data in accessible format. (CSV 0.12KB)
The outlook for the economy over the short and medium term is sensitive to the performance of a small number of large firms, a degree of concentration which introduces firm and sector-specific risks to the forecast. The pharmaceutical and ICT manufacturing sectors account for over three quarters of overall goods exports from Ireland and these sectors are dominated by a small number of predominantly US-owned firms. A downturn affecting specific sectors or a deterioration in the performance of an individual large MNE presents a key downside risk to the projections. This would result in lower exports but would also feed through directly to employment and tax revenue. The negative impact on the latter would extend beyond corporation tax given the significant proportion of income tax arising from high wage MNE-dominated sectors in Ireland. There is also the potential for exports to grow more rapidly than projected in this Bulletin. While exports in the first four months of the year were boosted by frontloading of output by firms, stripping out this effect there is some evidence of strong momentum in underlying goods exports related to weight-loss products, ingredients for which are manufactured in Ireland. The pharmaceutical sector in Ireland appears well placed to take advantage of rapidly rising global demand for these products.
A shortage of infrastructure in key areas is limiting the growth potential of the economy presenting an upside risk to inflation and downside risk to medium-term growth. The pace of growth in the population, employment and economic activity for at least the last decade has outstripped the increase in the capital stock in key areas including housing, energy, water and waste water. While the baseline forecasts in this Bulletin have been revised down, the economy is still projected to grow over the coming years at close to 2 per cent per annum. As demand increases, a failure to make significant progress in addressing infrastructure gaps would worsen the imbalance between demand and supply conditions. With services inflation running close to double the headline rate, this would put additional upward pressure on domestic prices. If this persisted, it would damage Ireland’s competitiveness in an environment where attracting new inward foreign direct investment is already likely to be challenging. With the economy at full employment currently, containing domestic price and wage inflation will be conditional on envisaged productivity growth emerging and avoiding an excessively expansionary fiscal stance.
Other risks to the projections relate to the sensitivity of inflation to the future path of volatile global commodity prices. Global energy commodity price assumptions have been revised downwards since QB1 but recent history demonstrates the volatility of these prices to international events. With geopolitical tensions remaining elevated, there is a risk that prices for energy and other key commodities such as food could be higher than envisaged in current assumptions and this represents an upside risk to the inflation projections in this Bulletin. Potentially pushing in the other direction, further weakening of global economic growth could reduce demand and exert additional downward pressure on commodity price futures.
Summary Forecast Table
Table 7: Baseline Macroeconomic Projections for the Irish Economy
| | 2023 | 2024 | 2025f | 2026f | 2027f |
|---|
Constant Prices | | | | | |
| Modified Domestic Demand | 2.6 | 2.7 | 2.0 | 2.1 | 2.2 |
| Modified Gross National Income (GNI*) | 5.0 | 4.1 | 2.0 | 2.5 | 2.5 |
| Gross Domestic Product | -5.5 | 1.2 | 9.7 | 2.7 | 5.6 |
| Final Consumer Expenditure | 4.2 | 2.3 | 2.6 | 2.2 | 1.9 |
| Public Consumption | 5.6 | 4.0 | 3.0 | 2.2 | 2.3 |
| Gross Fixed Capital Formation | 2.8 | -25.4 | 25.6 | 1.1 | 1.6 |
| Modified Gross Fixed Capital Formation | -4.4 | 2.3 | -0.6 | 1.7 | 2.7 |
| Exports of Goods and Services | -5.8 | 11.7 | 9.4 | 2.5 | 5.5 |
| Imports of Goods and Services | 1.2 | 6.5 | 7.3 | 2.0 | 3.5 |
| Total Employment | 3.4 | 2.7 | 2.1 | 1.9 | 1.8 |
| Unemployment Rate | 4.3 | 4.3 | 4.5 | 4.8 | 4.9 |
| Harmonised Index of Consumer Prices (HICP) | 5.2 | 1.3 | 1.9 | 1.8 | 1.7 |
| HICP Excluding Food and Energy (Core HICP) | 4.4 | 2.3 | 1.9 | 1.8 | 1.7 |
| Compensation per Employee | 6.7 | 3.6 | 4.1 | 3.7 | 3.6 |
| General Government Balance (% GNI*) | 2.7 | 7.4 | 2.6 | 2.8 | 2.3 |
| ‘Underlying’ General Government Balance (% GNI*)[12] | -1.3 | -2.1 | -2.2 | -2.2 | -2.4 |
| General Government Gross Debt (%GNI*) | 75.9 | 70.0 | 63.6 | 60.0 | 57.9 |
| Modified Investment (share of Nominal GNI*) | 18.1 | 17.9 | 17.1 | 16.6 | 16.3 |
Revisions from previous Quarterly Bulletin, p.p | | | | | |
| Modified Domestic Demand | - | - | -0.6 | -0.4 | 0.0 |
| Gross Domestic Product | - | - | 5.7 | -1.3 | 1.8 |
| HICP | - | - | -0.3 | -0.3 | 0.3 |
| Core HICP | - | -
| 0.0 | 0.0 | 0.2 |
Quarterly Bulletin No. 2 2025: Boxes
Box 1: Capacity constraints and construction sector activity
by Martin O’Brien and John Scally
The Irish economy is facing well-documented infrastructure challenges in housing, energy, water and transport, which to be addressed will necessitate a rise in construction sector activity. This Box examines the prospects for, and the implications of, a rise in the sector’s activity over the current forecast horizon to 2027, especially if the scale of existing infrastructure gaps are to be closed at a faster pace than envisaged in our current central outlook.
A sector’s output is determined by the amount of labour and capital available to it, in addition to the efficiency which those factors are put together and the institutional features of the sector and broader economy that influences their availability and efficiency. From a building and construction perspective, there are multiple demands arising for the sector covering (1) new residential dwellings, (2) maintenance/repair and retro-fitting of existing dwellings, (3) construction and improvements of non-residential buildings, and (4) construction and improvement of infrastructure (e.g. roads, railways, energy and water grids) to facilitate population growth and meeting climate change needs. While necessary investment in infrastructure enables the delivery of housing, much focus has been put on the acute shortfall of new dwellings, with the sector currently producing in the low region of about 30,000 units per annum while estimates of current need are of circa 52,000.
The volume and composition of expenditure in and, in turn, output of the Irish construction sector has changed over recent decades as the demands and constraints on the economy have shifted (Figure 1). Spending on new dwellings as a percentage of total construction expenditure fell to 8 per cent in 2013 having peaked at 47 per cent in 2006. Since then the share has increased to 26 per cent of total construction expenditure in 2024. Spending on home improvements has increased from 14 per cent in 1998 to 24 per cent of total spending in 2024, reflecting the need to update the energy ratings of the domestic building stock, as well as improvements and expansions as tightness in the housing market limited moving opportunities. Improvements have seen the most significant rise in volume and share of total building and construction expenditure since 2021, The volume of non-residential construction expenditure, covering public infrastructure and commercial real estate (CRE), has been static in recent years , as an easing of CRE activity is broadly offset by an increase in public infrastructure spending. Total construction employment increased to 176,000 in 2024 (6.3 per cent of total employment) from its post crisis trough of 85,000 in 2012 (4.5 per cent of total employment). Construction employment peaked at 237,000 in 2006 (11.1 per cent of total employment).
Construction of new dwellings as a share of overall construction activity remains relatively low
Figure 1: Construction expenditure (LHS) const prices €m, RHS construction employment (,000s)
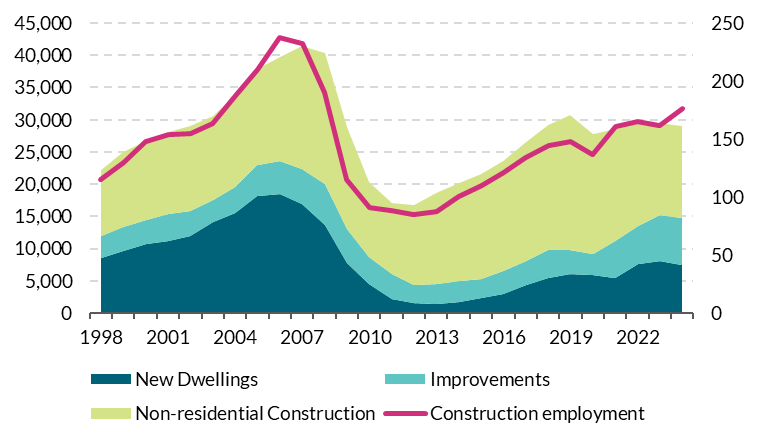
Source: CSO. Chart data in Accessible format. (CRDOWNLOAD 0.84KB)
Note: Chart shows a the evolution of the volume of construction spending and employment since 1998, with the former broken down by new dwe.
In 2025, construction employment remains 26 per cent below its pre-financial crisis peak, and the composition of employment across construction activities broadly reflects how expenditure is divided up among those activities. The share of civil engineering construction labour has increased from approximately 4 per cent of total construction employment in 2017 to 11 per cent in 2024, consistent with the increased demand for public infrastructure (Figure 2). With public infrastructure investment and the demands of retrofitting remaining strong, the prospect of a substantial labour reallocation toward new housing delivery from those activities is limited. In contrast, the slowdown in delivery of new commercial buildings may release some labour capacity in that direction. However, much of that activity has already eased during 2024, and any significant marginal gains in terms of labour devoted to housing delivery have likely already been realised. Indeed, the share of those construction workers working on housing (both new dwellings and improvements/retrofitting) increased over the course of last year with approximately 60 per cent now working in housing (Figure 3).
Civil engineering employment is accounting for a larger share of construction employment
Figure 2: Construction employment by subsector in ,000
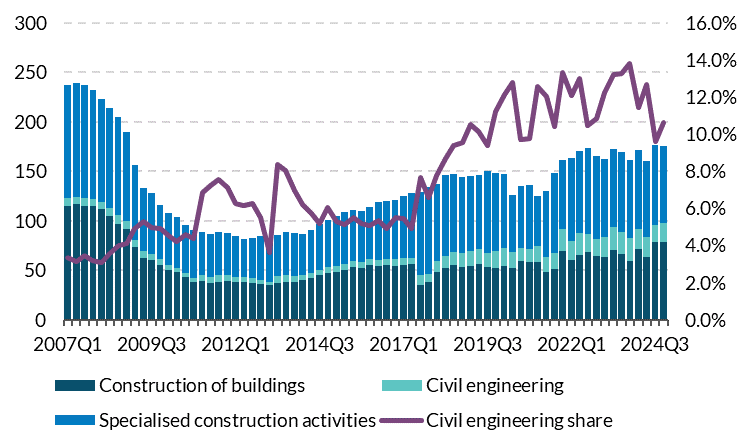
Source: CSO. Chart data in accessible format. (CRDOWNLOAD 2.02KB)
Note: Chart shows a stacked evolution of employment by construction sector by quarter. Specialised activities include activities such as pile-driving, foundation work, concrete work, brick laying, scaffolding, roof covering.
A larger portion of construction workers already work in housing
Figure 3: Construction employment in ,000
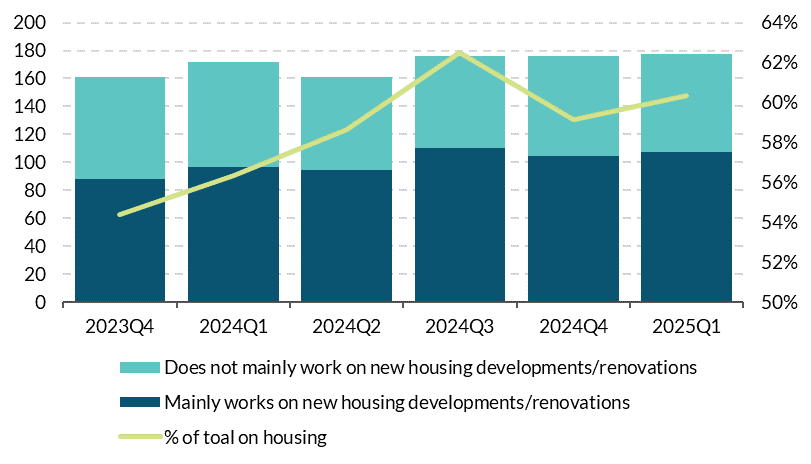
Source: CSO. Note: Chart shows a stacked evolution of housing and non-housing employment by quarter since 2023Q4. Chart data in accessible format. (CRDOWNLOAD 0.31KB)
Looking ahead, the overall demand for labour in the construction sector is expected to remain strong. Using published estimates of needs across new housing delivery, retrofitting and public capital investment, we estimate that the demand for labour in the construction sector could rise to 225,000 workers in 2027 at current levels of labour productivity. If met with supply, this would constitute an increase of approximately 30 per cent on employment levels in 2024 and would bring actual construction employment above its pre-crisis peak. It would also lead to an average annual increase of 13 per cent in the volume of building and construction activity over the next three years, assuming there were no other impediments in the building process
However, the central forecast in this Bulletin expects there to be binding constraints on the delivery of those estimated investment needs, with annual average growth of approximately 5 per cent in building and construction investment anticipated. Those constraints relate to the availability of labour and capital in the construction sector and the efficiency with which they are put together, which to a great extent relates to productivity.
Increasing labour availability for the construction sector can arise through inward migration, including that facilitated by work permits for non-EU workers, and through more domestic apprenticeships. The National Competitiveness and Productivity Council (NCPC) recently highlighted that permits for the construction sector still account for a relatively small proportion (less than 1 per cent in 2023) of total construction employment. On the domestic front, despite a pickup in construction and engineering courses in the last number of years, apprenticeships for certain occupations such as bricklayers, plasterers, painters, and decorators are low at just 482 nationally.
With the absolute number of construction workers being relatively limited in the short term, greater focus turns to the prospects for productivity – the amount of output per employee or hour worked – to facilitate the necessary increase in building and construction activity. However, the construction sector has for many decades been characterised by persistently low productivity when compared to other domestic sectors of the economy (Figure 4). When it arises, growth in construction sector gross value added (GVA) has historically been driven by increases in employment and hours worked. Consistent with the rest of the domestic economy, hours worked have typically grown more slowly than employment levels as average hours worked trends gradually downwards over time.
Productivity in the construction sector a drag on growth relative to other sectors in the domestic economy
Figure 4: Real GVA and contributions, annual average growth (%)
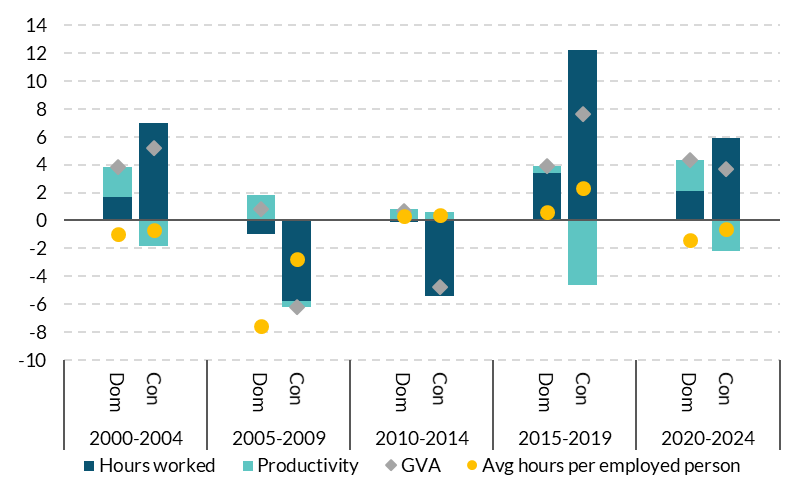
Source: CSO, Eurostat. Chart data in accessible format. (CRDOWNLOAD 0.48KB) Note: Chart shows the annual average growth in GVA for the domestically oriented sectors of the economy (Dom) and the construction sector (Con),broken down by the contribution of hours worked and labour productivity, across five-yearly blocks from 2000 to 2024. Domestic sectors are as defined by the CSO.
The relatively poor productivity performance of the construction sector in Ireland is also evident in a cross-country setting, and in 2024 was second lowest across comparable European countries (Figure 5). Amongst a number of factors related to this relatively low productivity includes the investment in and use of the sector’s own capital stock – that is the machinery, equipment and technology used to complement and maximise the labour input. This has been declining in Ireland for over a decade, at an annual average rate of 2.5 per cent (Figure 5). Reversing this trend would be an important part of promoting higher levels of labour productivity in the construction sector and could include, for example, greater adoption of Modern Methods of Construction (MMC). MMC requires less on-site labour and can help mitigate labour constraints by relying more on off-site manufacturing processes. Over time, MMC can lead to cost savings through economies of scale, reduced waste, and shorter construction timeframes.
Irish construction sector productivity is low compared to other countries and associated with declining investment in complementary machinery and technology by the sector itself
Figure 5: Labour productivity (2024 level) and growth in real capital stock per employee
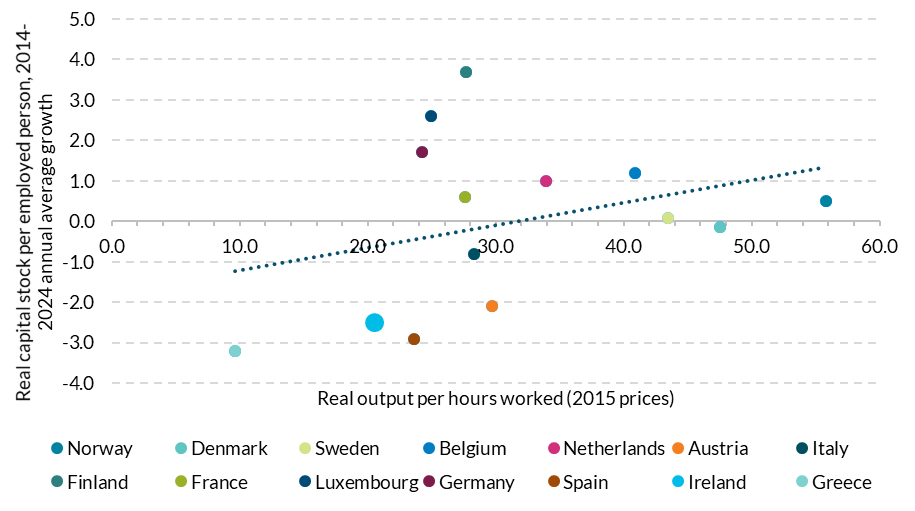
Source: Eurostat. Chart data in accessible format. (CRDOWNLOAD 1.45KB) Note: Chart shows a scatter plot of the level of construction sector labour productivity in Ireland and comparable European countries and their respective annual average change in real capital stock per employed person over the ten years from 2014 to 2024.
In the absence of greater productivity growth, higher levels of labour demand and activity in the construction sector would, all else being equal, lead to higher inflationary pressures generally. The persistently low productivity levels in the sector historically have contributed to above-average increases in unit labour costs relative to the rest of the domestic economy (Figure 6). If a greater share of activity in the domestic economy is devoted to a sector with relatively low productivity and higher unit labour costs then overall near-term inflationary pressures could be exacerbated, minimising the medium to long-term gains from the additional investment expenditure today.
Lower productivity leads to higher unit labour costs in the construction sector relative to the rest of the economy
Figure 6: Unit labour cost, % annual change
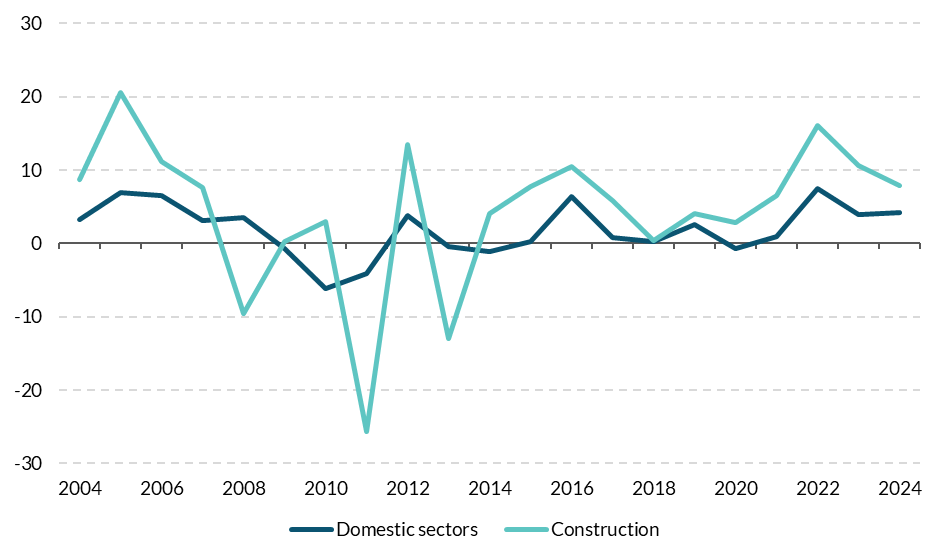
Source: CSO. Chart data in accessible format. (CRDOWNLOAD 0.4KB)Note: Chart shows time series of the annual growth rates in unit labour costs for the domestically oriented sectors of the economy and the construction sector. Domestic sectors are as defined by the CSO. Unit labour cost measures hourly employee compensation relative to real labour productivity per hour.
As noted in previous Central Bank staff analysis (PDF 1.09MB), higher productivity could arise from policies which promote economies of scale, as the preponderance of small firms in the sector limits scope for investment in new machinery, equipment and technologies to improve productivity. Such policies could include linking public procurement with use of innovative methods, or considering the role of land use regulation and value capture in incentivising scale of projects in areas of high demand. Delivering sustainably on the necessary rise in building and construction activity in the years ahead to address infrastructure gaps in housing, energy, water and transport will require a concerted effort to improve construction sector productivity.
Box 2: Insights from equity markets on the effect of tariffs on cash flows of MNEs operating in Ireland
by Nicholas Kaiser & Barra McCarthy
Recent changes in US trade policy pose a risk to goods-exporting firms operating in Ireland, and, thus, to the Irish economy. This group of firms is dominated by multinational enterprises (MNEs), particularly those producing pharmaceuticals, other medical goods and, to a lesser degree, semiconductors. The US is Ireland’s largest trading partner, accounting for 29 per cent of total Irish cross-border goods exports, pharmaceuticals making up the largest portion of these exports. Likewise, manufacturing companies (more broadly-defined than pharma and semi-conductor manufacturers, but dominated by them) contribute strongly to corporation tax and income tax revenue.
The economic impact of tariffs takes time to be felt but asset prices can provide real-time insight into market expectations of the impact of tariffs on future cash flows of MNEs. Share prices reflect market expectations of the future economic performance of a company, and change as those expectations are updated. In contrast, official statistics are produced with a lag, and the impact of tariffs may not appear immediately. We are able to study market movements around the recent announcement of tariffs on EU imports in the US to estimate the expected cash flow impact of these tariffs.
We derive an estimate of the impact of the recently announced tariffs on the expected future cash flows of a sample of goods exporting MNEs operating in Ireland following the event study approach of Amiti et al. (2025) to the 2018 US-China trade war. We focus on market movements following the initial announcement of tariffs on 2 April 2025 and up to the partial reversal of the policy a week later (four trading days). Our sample includes 44 companies, primarily in the pharmaceutical and medical device manufacturing industries, but also including some semiconductor manufacturers and large Irish MNEs. This estimate of the change in cash flows derived from asset price data is informative for understanding what the impact of tariff policy on those MNEs’ activity, employment and contribution to public finances could be.
Between 20 January 2025 and the US government’s announcement of tariffs on 2 April 2025, the share prices of our sample of publicly-traded goods-exporting MNEs operating in Ireland increased by approximately 2.8 per cent. Returns to the pharmaceutical and medical company stocks that make up the majority of our sample performed similarly over this period, having a weighted average cumulative stock price return of 2.4 per cent. The limited number of non-medical firms in our sample performed relatively better leading up to the tariff announcement, gaining 4.4 per cent. The tech stock-heavy S&P 500, however, fared worse in the first part of the year, seeing broad declines in price among its constituent stocks beginning in February.
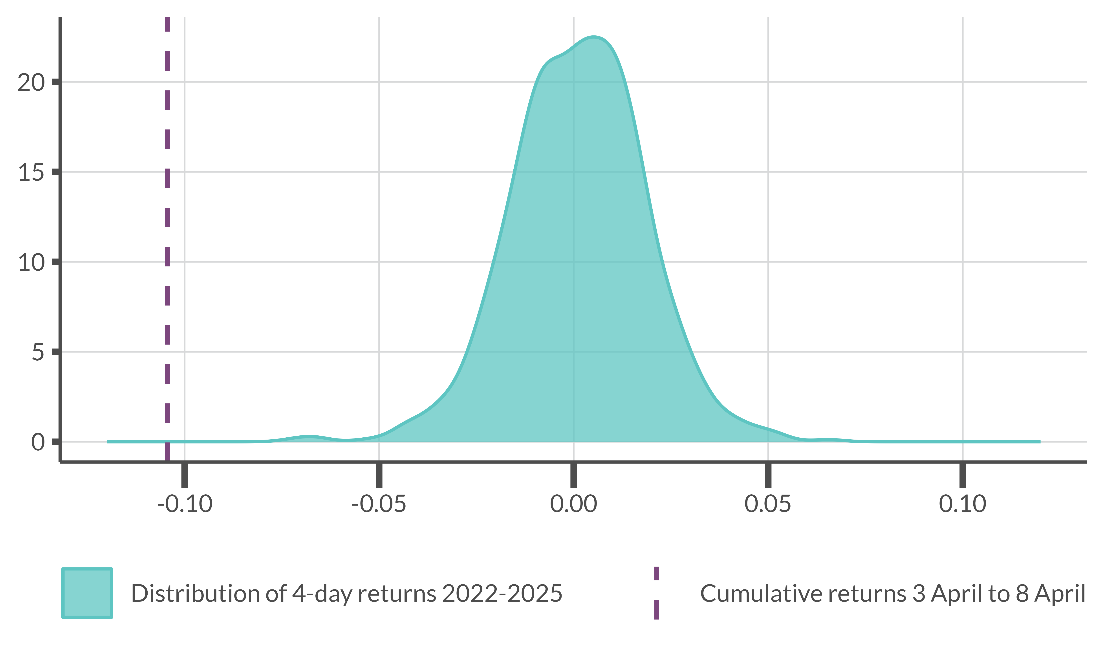
On 2 April, the US government announced widespread tariffs on US imports, but partially reversed those measures one week later. Even after the reversal, the effective tariff rate in the US was the highest it had been in over 100 years.On the four trading days between the announcement and reversal of these tariffs, the price of shares of the same goods-exporting MNEs operating in Ireland fell by 10.4 per cent, while shares of pharmaceutical/medical MNE stocks declined by 10.1% per cent, despite pharmaceuticals being exempt from the new tariffs (figure 1). These stock price declines could indicate that the announced measures went beyond market expectations of future tariff policy. Stock returns for pharma/medical MNEs without an Irish presence were affected in a similar manner by the tariff announcements.
Cumulative returns over the four trading days following the 2 April announcement were exceptionally low relative to typical four-day returns
Figure 1: Cumulative stock returns following tariff announcement and density of returns over other same-length windows
Source: Bloomberg. Chart data in accessible format. (CRDOWNLOAD 32.37KB)
Note: Chart shows density of cumulative 4-day weighted average log returns of sample of goods-exporting MNEs operating in Ireland, January 2022-April 2025. The vertical line indicates the cumulative returns of the same stocks between April 3 and 8 April 2025.
After the reversal of the announced tariff policy on 9 April, stock prices of goods-exporting MNEs with a presence in Ireland rebounded quickly, but more than a month later had not returned to their pre-announcement level, reflecting uncertainty about future tariff policy (Figure 2). Stock returns declined sharply following the 2 April tariff announcement but partially rebounded after the policy was reversed
Figure 2: Cumulative stock returns of S&P 500 and goods exporting MNEs operating in Ireland
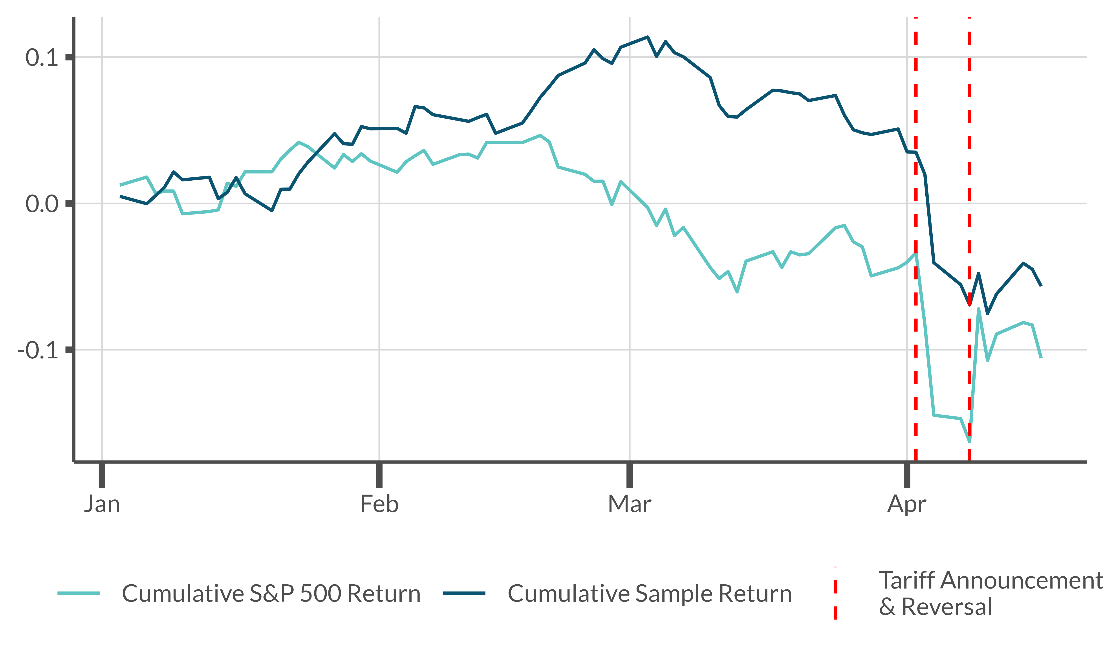
Source: Bloomberg & [S&P source]. Chart data in accessible format. (CRDOWNLOAD 7.2KB)
Note: Chart shows cumulative log returns of S&P 500 and the sample of goods-exporting MNEs operating in Ireland January to 22 April 2025. The red dashed line indicates the date the US government announced new tariffs.
In order to estimate the impact of the tariffs on future cash flows, we follow the methodology in Amiti et al. (2025). We first estimate the effect of the 2 April tariff announcement on each firm’s enterprise value, controlling for surprises in economic data releases, and using a window of four trading days after the announcement (up to the reversal of the policy). We then estimate the impact of the tariff announcement on firm discount rates, defined as the sum of the deviation in future risk-free rates and the firm-level deviation in future excess stock returns induced by the tariff announcement. The sum of the impact of the tariff announcement on firm values and on firm-level future discount rates gives us an estimate of the expected deviation in future cash flows. The four-day window over which we analyse market movements allows time for markets to price in expectations of the impact of the new tariffs, but longer windows also leave room for unrelated news to have an impact on stock prices. The announcement of tariffs on 2 April was widely expected, so financial markets had priced in expectations of the policy prior to the official announcement. Therefore, the response of financial markets after the announcement and our estimates, which are derived from these market responses, reflect the degree to which details of the policy were unexpected. The response to the 2 April tariff announcement suggests that markets expected an average 5.4% decline in future cash flows relative to market expectations before the announcement. For the top five firms in the sample by employment in Ireland (employing approximately 29,000 people), this amounted to 3.3%, though overall there is not a significant relationship between the tariffs’ impact on firm cash flows and the employment levels of these companies in Ireland. A large share of Irish employment and investment is accounted for by MNEs, so a decline in cash flows to these firms could lead to negative consequences for the Irish economy, including reduced employment, investment, and tax revenue.
In conclusion, this Box has considered movements in financial markets around the announcement of tariffs on EU imports by the US in order to estimate the expected impact of these tariffs on the future cash flows of goods exporting MNEs operating in Ireland. We find that financial market movements imply an average expected 5.4% decrease in future cash flows due to the announced tariffs for these companies. Using financial market data, we were able to produce an estimate of the potential impact of tariffs on the future cash flows of MNEs in Ireland in close to real time and show their impact to be negative. While it is clear the markets reacted negatively to the 2 April tariff announcement, much uncertainty remains. On 23 May, the US announced revised tariffs on EU imports and then shortly after announced the intention to enter negotiations toward a trade deal with the EU. The uncertainty surrounding future trade policy could make financial markets a less reliable source of information for understanding the expected impact of tariffs.
Box 3: Decomposing Economic Growth – The Role of Human Capital Accumulation
by Enda Keenan and Tara McIndoe-Calder
Human capital has played a central role in supporting Ireland’s economic expansion, underpinning productivity gains and facilitating structural transformations across sectors. Bergin and Kearney (2007) assess the contribution of high and low-skilled labour toward Irish economic growth as part of a wider structural model. Using the same accounting decomposition of the labour contribution to growth, Fitzgerald (2012) estimates that productivity was the largest driver of average economic growth for the majority of EU countries between 1995 and 2010. An important finding is that the contribution of human capital, as measured by the education level of the working age population, rises notably when accounting for its indirect effect on the underlying drivers of labour force participation, unemployment and productivity. These indirect effects are explored using counterfactual simulations for each channel and comparing them with outturn data. This work updates the Fitzgerald (2012) methodology with data from 1995 to 2023 to reflect more recent labour market developments and highlight areas of policy relevance for future growth.
Educational attainment level, as measured by the share of the working age population aged 25-64 years with a tertiary-level qualification, has risen noticeably in Ireland from 19.9 per cent in 1995 to 53.3 per cent in 2023 (Figure 1). These improvements have facilitated broader structural shifts towards a higher share of services employment and highly skilled jobs. The higher attainment level is observable across gender and age groups with the net inward migration of highly skilled workers adding further to domestic human capital accumulation. Ireland ranks highest in EU in 2023 for persons in the working age population with tertiary-level education, ahead of Luxembourg and Cyprus.
Tertiary-level educational attainment has improved across the board in Ireland
Figure 1: Share of working age population with tertiary-level education (1995-2023)Share of working age population (%)
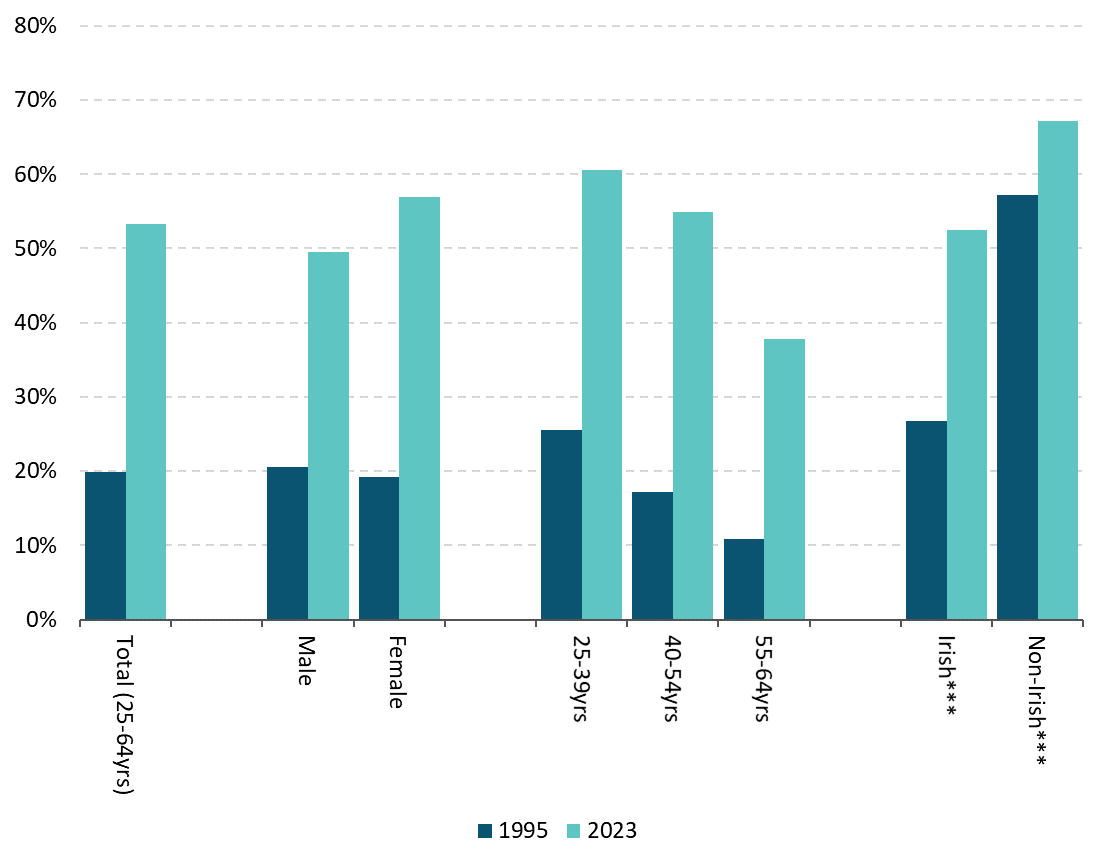
Source: CSO and Eurostat.
Note: Chart shows the share of the working age population (aged 25-64 years) with tertiary-level education in 1995 and 2023. *** Data for Irish and non-Irish citizens compares 2003 levels to 2023 due to limited data availability.
Accessibility: Chart Data in Accessible Format (CRDOWNLOAD 0.2KB)
In order to update the decomposition applied in Fitzgerald (2012) to 2023 data for all EU Member States, we use the following framework:

Where average GDP growth per capita in country between 1995 and 2023 () is a function of changes in productivity (GDP per employment, ), the employment rate (inverse unemployment rate, ) and labour force participation rate (LFPR, ). For widely-documented reasons, we include two series for Ireland using both GDP and GNI* given the distortionary effect of MNE-related activity on headline GDP. The decomposition of growth for GNI* shows a relatively larger contribution from LFPR to average annual economic growth of 1.9 per cent compared to productivity (0.6pp) and changes to unemployment (0.3pp) (Figure 2). Using the GDP measure for Ireland, productivity growth accounted for 2.8pp of the average 4.1 per cent annual average growth. In comparing the contributors to growth, the labour market-led growth in GNI* in Ireland suggests a story of convergence with notable demographic and structural shifts in the economy over the period. The coefficients for each explanatory variable within this accounting decomposition are then used as the weights in the counterfactual analysis for estimating the contribution of human capital to growth.
Improvements in labour force participation have a more pronounced effect on economic growth in Ireland when using GNI* relative to GDP
Figure 2: Contribution to average annual GDP/GNI* growth per capita (1995-2023)Average annual growth (%)
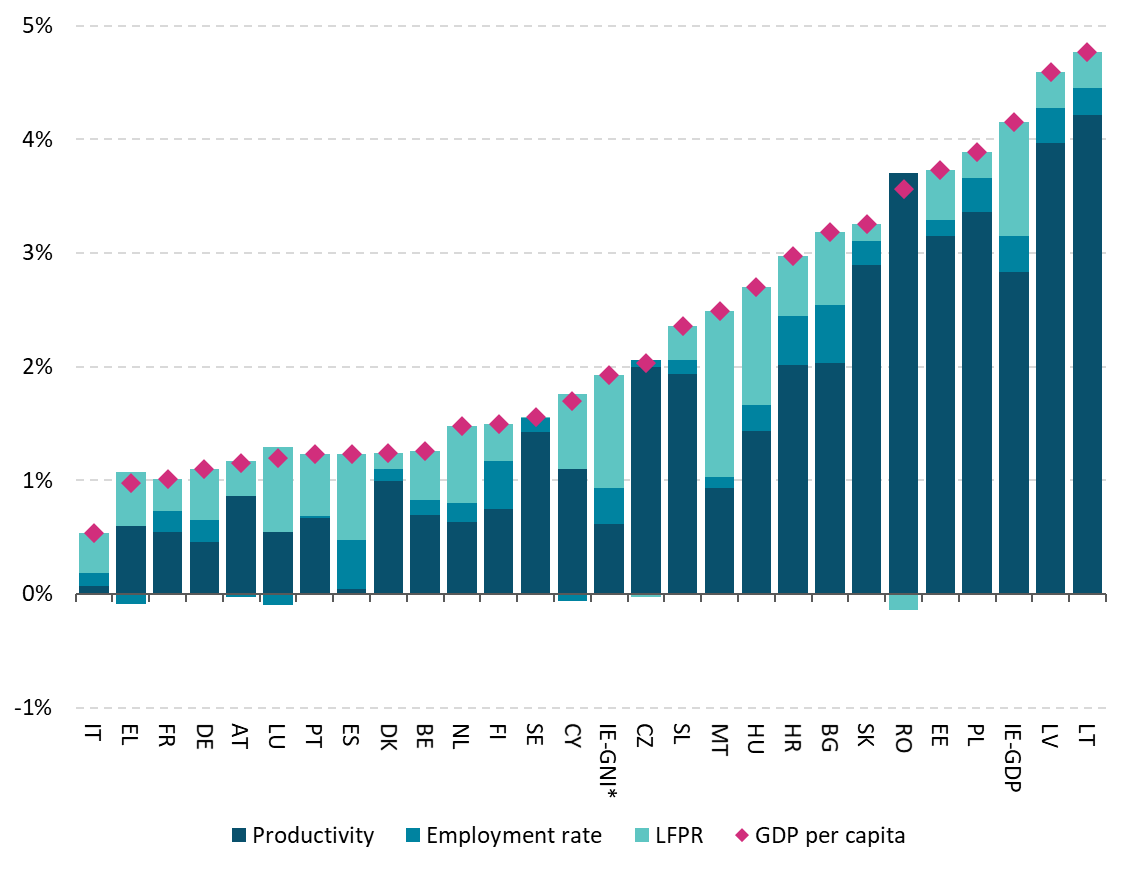
Source: Eurostat, OECD and author’s calculations. Chart data in accessible format. (CRDOWNLOAD 0.72KB) Note: Chart shows a decomposition of average annual GDP growth per capita in EU countries between 1995 and 2023. The components are productivity, employment rate and labour force participation.
Human capital influences each of these explanatory variables – productivity, the employment rate and the labour force participation rate. For example, higher levels of educational attainment improve productivity, reduce the likelihood of remaining in unemployment for extended periods and improve labour force attachment given the relative financial return from employment compared to inactivity. In order to estimate a counterfactual analysis with respect to human capital effects, we assess the relative change in each explanatory variable had the educational composition of the working age population remained unchanged since the start of the sample period.
In the case of labour force participation, we apply the 2023 labour force participation rates by educational attainment group to the 2023 population assuming that the breakdown of the labour force by educational attainment remains fixed at it 1995 levels. This suggests that in the absence of the improvement in the educational attainment of the population, the labour force in all countries would have been substantially lower in 2023 than actual observed levels. The same calculation is applied to the employment rate to generate a hypothetical level of unemployment if the education profile of the population had remained unchanged.
In order to estimate the human capital effect on productivity, we first have to construct a human capital index (HCI) by weighting the share of the population aged 25-64 years in each educational attainment group by the average returns to education for each group, as estimated by the OECD. An increase in the HCI over time indicates a steady rise in the human capital of the working age population. Ireland has ranked highest in the EU since 2010 due to the relatively large share of the working age population with third-level qualifications (Figure 3). The effect on productivity is estimated by calculating the average annual change in the human capital index between 1995 and 2023.
Ireland leads the Human Capital Index for the EU given its larger population share with tertiary-level education
Figure 3: Human Capital Index range for EU countries (1995-2023) Index
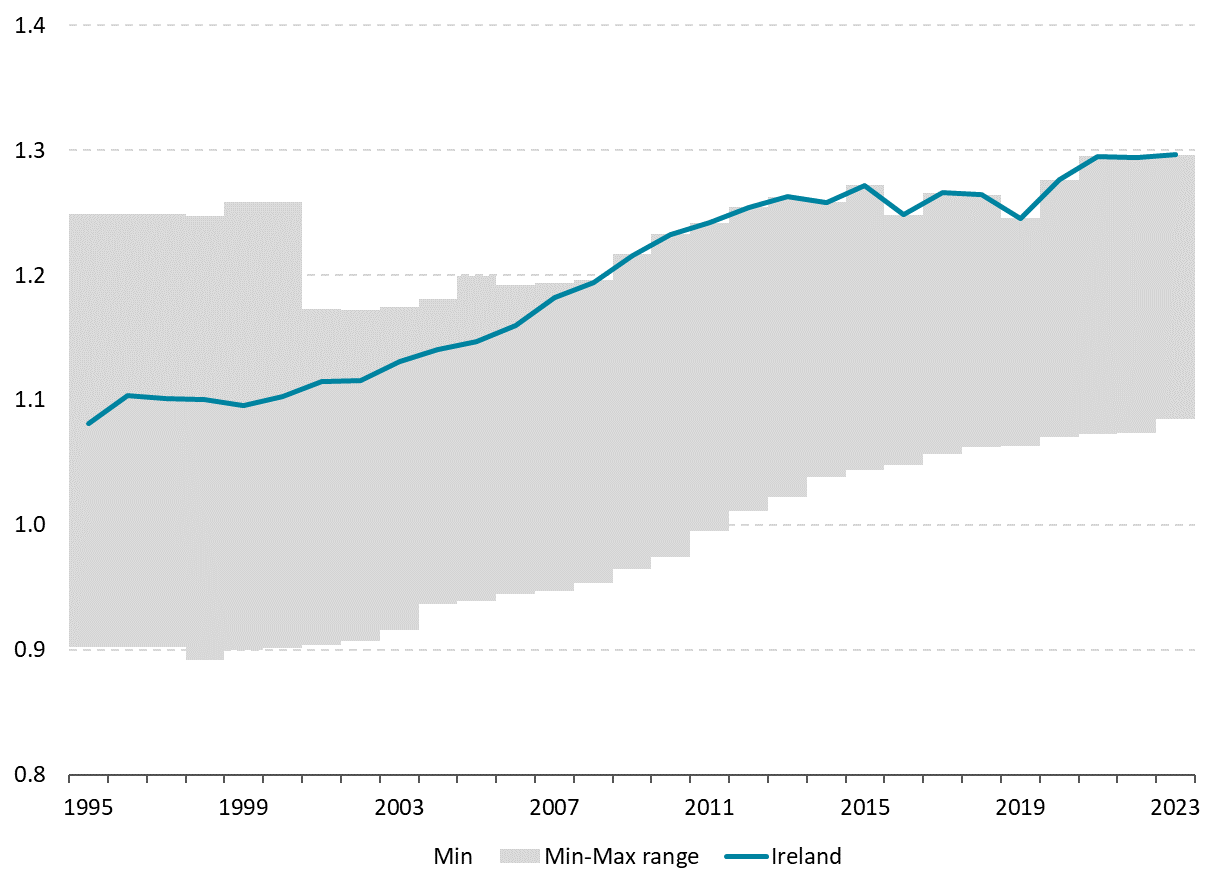
Source: Eurostat, OECD and author’s calculations. Chart data in Accessible format. (CRDOWNLOAD 1.21KB)Note: Chart shows the maximum and minimum range of the human capital index for EU countries between 1995 and 2023. The blue line denotes Ireland’s index and rank within the data each year.
We subtract the average annual growth rates in the counterfactual scenario from the actual observed average growth rates to estimate the contribution of human capital (education) to productivity, the employment rate and the LFPR. These values are then weighted by the coefficients from the original decomposition. The remaining gap leaves the cumulative impact of education shown as a separate contribution to the average annual change in GDP or GNI* per capita.
This adjusted decomposition shows that rising educational attainment accounts for more than half of total per capita growth for 14 of the 28 economies (Figure 4). For Ireland (using GNI*), education accounted for 1.7pp of the average 1.9 per cent annual GNI* growth per capita over the sample period with the direct effect of LFPR (0.2pp) on growth being the next highest driver. Overall, the results are comparable to Fitzgerald (2012) as the cumulative impact of education has a greater impact on economic growth per capita in Ireland since 1996 than in the other EU countries.
Education the dominant driver of economic growth in many countries, with a particularly large contribution in Ireland
Figure 4: Adjusted decomposition of average annual GDP growth per capita (1995-2023)Average annual growth (%)

Source: Eurostat, OECD and author’s calculations. Chart data in accessible format. (CRDOWNLOAD 0.9KB)Note: Chart shows an adjusted decomposition of average GDP growth per capita from 1995 to 2023 into productivity, employment rate, labour force participation and education.
Regarding future prospects for the potential growth rate of the Irish economy, the current unemployment rate is close to historical lows and labour force participation has increased notably in recent years following a rise in female activity levels. Cohort effects – whereby younger and higher-educated workers replace older workers with lower levels of educational attainment – may add to growth over the short and medium-term. However, the analysis in this Box shows that levels of educational attainment in Ireland are already at all-time highs by historical comparison and relative to other EU countries. This implies that the impetus to growth from educational attainment in future years is likely to be reduced. Human capital will remain a critical driver of Irish economic growth but sustained growth from educational expansion is more likely to come from the better alignment of human capital to labour market demand (Fitzgerald, 2019).
An Timpeallacht Gheilleagrach
Agus an cúlra eacnamaíoch domhanda ag athrú i gcónaí, tá an t-ionchas do gheilleagar na hÉireann á múnlú ag an éiginnteacht ardaithe, ar gné sheasmhach i gcónaí í. Mar gheilleagar beag, oscailte a bhfuil caidreamh suntasach trádála agus infheistíochta aige le SA agus AE, tá drochiarmhairtí an chaidrimh gheopholaitiúil athraithigh le brath faoi láthair agus, beidh le brath amach anseo, ag geilleagar na hÉireann. Le linn na tréimhse athraithí seo, beidh sé deacair scagadh a dhéanamh ar theagmhais, ar fhógraí agus ar shonraí chun comharthaí fiúntacha a bhaint astu maidir leis na hionchais d’earnálacha éagsúla an gheilleagair. Mar sin féin, i bhfianaise constaicí gearrthéarmacha agus meántéarmacha ar ghníomhaíocht eacnamaíoch ó fhoinsí idirnáisiúnta agus intíre araon, tá deiseanna ann athléimneacht fhadtéarmach a bhunú sa gheilleagar agus san airgeadas poiblí leis an mbeartas intíre trí sholáthar a neartú sa gheilleagar.
Go dtí seo in 2025, tá an ghníomhaíocht eacnamaíoch phríomha in Éirinn á múnlú go díreach ag an éiginnteacht beartais, go háirithe an éiginnteacht a bhaineann le haistrithe suntasacha ar bheartas trádála sna Stáit Aontaithe. Leis na honnmhairí fíorláidre agus táirgeacht láidir OTI sa chéad ráithe, léirítear go páirteach freagairt na bhfiontar ilnáisiúnta do na hionchais maidir le forchur taraifí nó bearta eile níos déanaí sa bhliain. D’ainneoin thús-ualú na gníomhaíochta, rud a tharla go mór mór san earnáil cógaisíochta, tá ionchais fhadtéarmacha an mhargaidh maidir le brabúsacht FINanna ar fud oibríochtaí monaraíochta na cógaisíochta, theicneolaíocht an leighis agus TCF in Éirinn níos diúltaí ná mar a bhí roimhe seo i bhfianaise sheasamh athraitheach beartais SA (Bosca 2).
I bpríomh-mhéadrachtaí gheilleagar na hÉireann, léireofar cur chuige FINanna a ndéantar difear dóibh maidir leis na costais táirgthe níos airde a bhaineann le constaicí taraife agus neamhtharaife níos airde a iompar. I dteannta gníomhaíocht thomhaiste, is dócha go mbeidh brabúis luaineach sa ghearrthéarma agus sa mheántéarma. Astu féin, bheifí ag súil go laghdófaí brabúis FINanna in Éirinn faoi dheoidh de thoradh costais táirgthe agus dáilte níos airde, agus bheadh impleachtaí diúltacha aige sin d’fháltais ó cháin chorparáide i gcomparáid leis an taithí a bhí ann go dtí seo. San fhadtéarma, go háirithe dá mbeadh athruithe níos leithne i gceist ar an mbeartas cánach agus tionscail, tá an baol ann go mbeadh laghduithe níos bunúsaí ar shreafaí infheistíochta agus ar struchtúir mhalartacha do shlabhraí luacha Fin ina mbac suntasach ar fhíorghníomhaíocht eacnamaíoch agus ar fhostaíocht sa Stát, rud a ghéaródh na dúshláin don airgeadas poiblí. In Alt Sínithe a foilsíodh i dteannta leis an bhFaisnéis Ráithiúil seo, léirigh Boyd et al (2025) na himpleachtaí a bheadh ann i gcás den sórt sin, sa chaoi go bhféadfadh easnamh sa bhreis ar 4 faoin gcéad d’OIN* teacht chun cinn i gcomhardú an rialtais ghinearálta faoi 2030, agus go méadódh an fiachas rialtais ghinearálta go dtí 90 faoin gcéad d’OIN* thar an tréimhse chéanna.
Bíonn iarmhairtí ag forbairtí geo-eacnamaíocha ar na hionchais d’onnmhaireoirí Éireannacha agus d’infheistíocht agus do thomhaltas intíre freisin. Tá an t-ionchas lárnach don gheilleagar intíre sách fabhrach idir seo agus 2027, in ainneoin go bhfuil go bhfuil maolú breise tagtha air ó réamhaisnéis mhí an Mhárta i leith de thoradh éifeachtaí na héiginnteachta méadaithe agus na dtaraifí éifeachtacha níos airde. Meastar go bhfanfaidh an dífhostaíocht íseal, fad a thuartar go bhfanfaidh an boilsciú ar phraghsanna do thomhaltóirí ag leibhéil inbhuanaithe. Ar an gcaoi chéanna, is dócha go leanfaidh fíorioncaim na dteaghlach de bheith ag méadú, rud a thacóidh le luas seasmhach an fháis ar chaiteachas tomhaltóirí. Níl na hionchais ghearrthéarmacha maidir le hinfheistíocht chomh buacach céanna, áfach, rud a chuireann srianta breise ar na hionchais maidir le ráta ionchasach fáis an gheilleagair sa mheántéarma. Is dócha go ndéanfaidh éiginnteacht ardaithe difear d’infheistíocht i ngnó fisiciúil. Cé go meastar go mbeidh méadú de réir a chéile ar infheistíocht tithíochta, is dócha nach mbeidh sé leordhóthanach chun an bhearna idir soláthar agus éileamh measta sa mhargadh sin a shárú.
Tá an t-ionchas an-íogair don chaoi ina bhforbróidh na pléití maidir le rátaí taraife éifeachtacha, do mhéid na héiginnteachta beartais agus iarmhairt na ndálaí maoiniúcháin. I bhfianaise raon na gconairí féideartha atá ann don gheilleagar, tá cás níos díobhála ag gabháil leis an réamhaisnéis lárnach san Fhaisnéis Ráithiúil seo ina léirítear meathlú níos géire ar dhálaí trádála, leibhéil éiginnteachta beartais níos seasmhaí, agus dálaí maoiniúcháin níos déine. Cé go bhfuil luas measta an fháis ar OTI agus MDD i bhfad níos ísle thar thréimhse na réamhaisnéise go dtí 2027 sa chás níos díobhálaí ná mar atá sa chás lárnach, ní thagann cúngú ar ghníomhaíocht eacnamaíoch chun cinn. Mar a chuirtear in iúl thuas, áfach, d’fhéadfadh aistrithe níos suntasaí fós ar infheistíocht dhíreach agus ar shlabhraí luacha teacht chun cinn sa mheántéarma agus san fhadtéarma. Thairis sin, tá na réamh-mheastacháin sa chás lárnach agus sa chás díobhálach araon faoi réir éiginnteacht mhór ó tharla go bhfuil na cáis éagsúla taraife atá á gcur san áireamh gan fasach le blianta beaga anuas, go háirithe agus an geilleagar domhanda chomh comhtháite seo.
Cé go dtugann an éiginnteacht a bhaineann leis an gcúlra geo-eacnamaíoch le tuiscint go mbeidh fás eacnamaíoch níos maolaithe ann le rioscaí breise ar an taobh thíos, ní léir na himpleachtaí a bheidh ann don bhoilsciú mar d’fhéadfadh rioscaí ar an taobh thuas agus ar an taobh thíos a bheith i gceist. Sa ghearrthéarma agus sa mheántéarma, áfach, tá an t-ionchas lárnach don bhoilsciú in Éirinn, agus sa limistéar euro ina iomláine, sách fabhrach. Ó thaobh an limistéir euro de, tugann na táscairí le tuiscint go socróidh boilsciú thart ar sprioc mheántéarmach na Comhairle Rialaithe arb ionann é agus 2 faoin gcéad. Bunaithe ar a mheasúnú is déanaí ar an ionchas don bhoilsciú, ar na forbairtí ar bhearta maidir le croí-bhoilsciú agus ar neart an tarchuir beartais airgeadaíochta, chinn an Chomhairle Rialaithe i mí an Mheithimh go laghdófaí rátaí beartais arís faoi 25 bhonnphointe. Leanfar de chinntí maidir le ráta beartais amach anseo a dhéanamh ar bhonn comhchosúil chun a chinntiú go gcobhsóidh boilsciú ar mhodh inbhuanaithe ag sprioc 2 faoin gcéad sa mheántéarma.
Féadfaidh tosca intíre gníomhú in aghaidh éifeachtaí diúltacha na gconstaicí seachtracha ar na spreagthaí d’fhás inbhuanaithe fadtéarmach i ngeilleagar na hÉireann, nó féadfaidh siad iad a mhaolú. Ó thaobh dearcadh fadtéarmach de, bhí leibhéil ardaitheacha na gnóthachtála oideachasúla ina spreagadh suntasach don fhás i ngeilleagar na hÉireann le roinnt mhaith blianta anuas. I gcomparáid le Ballstát AE eile, ba mhó an tairbhe don fhás in Éirinn a rinne leibhéil níos airde caipitil dhaonna trí bhíthin an oideachais mar gheall ar an iarmhairt dhearfach a bhí aige ar rannpháirtíocht sa lucht saothair, ar fhostaíocht agus ar táirgiúlacht (Bosca 3). Tá an cion den daonra atá in aois oibre agus a bhfuil oideachas tríú leibhéal acu in Éirinn ar an gceann is airde san Aontas Eorpach. Dá thairbhe sin, is dócha gur gá go dtiocfaidh gnóthachain imeallacha amach anseo, chun tacú le fás fadtéarmach, ó mhodhanna eile seachas díreach ó mhéadú ar líon na ndaoine a bhfuil cáilíochtaí tríú leibhéal acu. Chuige sin, bheadh ailíniú níos fearr scileanna ag teastáil, nó laghdú ar an ionchas maidir le neamhréir post, lena n-áirítear trí thionscnaimh chun tacú le foghlaim ar feadh an tsaoil agus le hoiliúint lár-ghairmréime, go háirithe i bhfianaise luas an athraithe ar dhigitiú agus i bhfianaise dul chun cinn teicneolaíochta eile.
Seachas caipiteal daonna a fheabhsú, féadfaidh feabhsuithe ar thosca táirgiúlachta eile rannchuidiú go mór le fás inbhuanaithe fadtéarmach freisin. Bainfidh earnálacha áirithe, amhail an earnáil foirgníochta, leas suntasach as infheistíocht a dhéanamh in innealra agus i dtrealamh agus as glacadh teicneolaíochtaí nua chun táirgiúlacht na hearnála a neartú. Tá sé ríthábhachtach táirgiúlacht a mhéadú san earnáil foirgníochta chun a chumasú dó freastal ar an éileamh méadaitheach ar thithíocht agus ar bhonneagar gaolmhar uisce, fuinnimh, iompair agus cumarsáide. Is srianta láithreacha iad seo ar chumas fáis an gheilleagair agus ar chumas an gheilleagair caighdeáin mhaireachtála na hÉireann a chosaint ar bhonn leathan, inbhuanaithe sa lá atá inniu ann agus amach anseo. D’fhonn freastal ar na bunéilimh ar ghníomhaíocht tógála agus foirgníochta le haghaidh bonneagar nua tithíochta, iarfheistithe agus poiblí ag leibhéil reatha na táirgiúlachta sna trí bliana atá le teacht, bheadh gá le méadú measta 30 faoin gcéad ar fhostaíocht san earnáil foirgníochta. Is ionann é seo agus trí oiread a mheánráta fhadtéarmaigh agus iolraithe ar ráta an fháis mheasta iomláin ar fhostaíocht. Trí tháirgiúlacht na hearnála foirgníochta in Éirinn a mhéadú chuig meánleibhéal gheilleagair inchomparáide na hEorpa, d’fhéadfaí aschur níos mó a bhaint amach agus an gá atá le méadú den sórt sin ar fhostaíocht i leith tacar scileanna atá sách gann a laghdú. Le hidirghabhálacha beartais, féadfar rannchuidiú le gnóthachain táirgiúlachta a spreagadh trí sholáthar poiblí a nascadh le húsáid modhanna nuálacha, mar shampla, nó trí bhreathnú ar an ról atá ag rialáil úsáide talún agus ag bearta chun luach talún a léiriú d’fhonn scála tionscadal a spreagadh i gceantair ina bhfuil ardéileamh.
Le beartas eacnamaíoch intíre, tá an deis ann aidhmeanna comhlántacha a bhaint amach maidir le fás eacnamaíoch inbhuanaithe a chothabháil agus athléimneacht níos fadtéarmaí a chothú i bhfianaise na móraistrithe atá ag teacht ar an ngeilleagar. Is gá calabrú cáiréiseach a dhéanamh ar bheartas fioscach chun a chinntiú go bhfuil spás leordhóthanach eacnamaíoch agus fioscach ann sa chaoi gur féidir an méadú riachtanach ar chaiteachas caipitil phoiblí a bhaint amach ar bhonn inbhuanaithe chun dul i ngleic leis na bearnaí atá ann i mbonneagar tithíochta, uisce agus fuinnimh sa ghearrthéarma agus sa mheántéarma, lena n-áirítear na cinn sin a eascraíonn as dul i ngleic leis an athrú aeráide. Ag an am céanna, tá an gá le rioscaí don airgeadais poiblí a laghdú ag éirí níos géire, ar rioscaí iad a eascraíonn as bonn cánach atá ró-chúng, i bhfianaise an spleáchais ar fháltais ó cháin chorparáide ó líon beag FIN a fhéadfaidh a bheith níos leochailí de thoradh ilroinnt gheo-eacnamaíoch. Tá maoláin á mbunú anois trí bhunú an Chiste um Éire sa Todhchaí agus an Chiste Bonneagair, Aeráide agus Nádúir. Ach, iontu féin, ní fhaigheann siad réidh leis an ngá atá ann an t-airgeadas poiblí a chur ar chonair inbhuanaithe fhadtéarmach. Is tosaíocht i gcónaí é an tiomantas do bhonn inchreidte fioscach lena gcuirtear méaduithe inbhuanaithe ar ghlanchaiteachas rialtais i bhfeidhm le himeacht ama. Leis sin, cumasófar beartas fioscach fritimthriallach éifeachtach agus airgeadas poiblí níos athléimní san fhadtéarma. Ar an gcaoi chéanna, chruthófaí an spás riachtanach fioscach agus eacnamaíoch, i gcomhthéacs bonn inchreidte fioscach, dá nglacfaí bearta praiticiúla chun an bonn cánach a leathnú, d’fhonn an méadú riachtanach ar chaiteachas caipitil phoiblí a chumasú agus costas eile a mhaoiniú chun leibhéil reatha seirbhísí poiblí a chothabháil de réir mar a fhorbraíonn riachtanais an daonra.
Ní bheidh infheistíocht i gcaipiteal poiblí ann féin leordhóthanach chun dul i ngleic leis na bearnaí atá tagtha chun cinn i mbonneagar tithíochta agus i mbonneagar níos leithne eile. Dá bhrí sin, ba cheart go mbreithneofaí go gníomhach athchóirithe ar infheistíocht phríobháideach sluachistithe le beartas fioscach agus beartas níos leithne. I measc na ndeiseanna atá ar fáil anseo, áirítear dul chun cinn a dhéanamh maidir leis an Aontas Coigiltis agus Infheistíochta (SIU), lena gcumasófar ionchais níos fearr do theaghlaigh in Éirinn agus ar fud AE chun torthaí ar a gcuid coigilteas a mhéadú agus rogha níos fearr maoiniúcháin a chur ar fáil le haghaidh infheistíocht tháirgiúil phríobháideach. I gcoitinne, d’fhéadfadh gur freagairt éifeachtach d’iarmhairtí eacnamaíocha na hilroinnte geo-eacnamaíche domhanda í iarracht chomhbheartaithe chun na constaicí atá fágtha ar thrádáil agus infheistíocht laistigh den AE a laghdú agus chun buntáistí breise Mhargadh Aonair AE a bhaint amach.
Supplementary Data
Endnotes