Key Insights
This insight introduces a toolkit that integrates national-level macroeconomic, survey, commodity, and financial data to provide timely estimates of headline HICP inflation in the euro area.
The toolkit is updated on a weekly basis and provides detailed breakdowns of how new data flows drive nowcast revisions, enabling transparent and informed policymaking.
The model successfully identifies evolving inflationary pressures through frequent updates, as demonstrated by the March 2026 case study of energy price-driven inflation.
Why Nowcast Inflation?
Understanding the current state of the economy is of vital importance to policymakers. However, due to the time required to collect and collate macroeconomic data, decision-makers often do not have access to information about the current period when making decisions. In the context of inflation data for the euro area, which is the subject of this insight, preliminary flash inflation data are typically released on the first day of the following month, meaning that the Governing Council of the European Central Bank (ECB) lacks this information when making decisions for that month. This can be particularly concerning in uncertain times, where prices adjust rapidly, meaning that the latest reported inflation is likely to be a poor estimate of current economic conditions. The recent increase in geopolitical risks means that economic conditions are now more prone to these rapid changes, so the ability to provide timely assessments of economic conditions is of utmost importance for informing policymaking. The need to provide up-to-date predictions of, as-yet, unreleased economic data for the current period has driven a large literature on nowcasting.
The methods used to construct these predictions vary widely. In economics, the predominant approach is to use dynamic factor models, for which a prominent example is the GDP nowcasting model of the Federal Reserve Bank of New York (Bok et al., 2018). More recently, researchers have increasingly used machine learning algorithms, which has the advantage of allowing for nonlinearities (Richardson et al., 2021). However, there is no guarantee that machine learning approaches will offer better predictions. For example, a recent paper by Akepanidtaworn and Akepanidtaworn (2025) found that, for nowcasting GDP, traditional methods continue to outperform machine learning algorithms. The drawback of machine learning is often interpretability of the results, with random forests and neural networks (two of the most promising algorithms regarding prediction) often criticised for being "black boxes" Aria et al. (2021). The criticism can limit the usefulness of such methods in policymaking, where understanding the source of the revision is often almost as important as the point estimate itself. Although the nowcasting literature has predominantly focused on GDP, nowcasting inflation is clearly also of vital importance to central banks. For example, the Cleveland Fed produces nowcasts for headline and core inflation using the approach outlined in Knotek and Zaman (2017), and a recent ECB working paper showed that high frequency scanner data improves nowcasts of inflation in Germany (Beck et al., 2024). Dynamic factor models (DFMs) have also been used to produce accurate nowcasts of US inflation (Modugno, 2013). We also adopt a DFM approach, as the accuracy and interpretability of the DFM makes it particularly appealing in a policy setting.
The goal of nowcasting is to provide an up-to-date assessment of economic conditions. This means making the most of the information available. In Europe, national-level data are often released earlier than the euro area aggregates, which provides us with a natural source of timely information that can be used to inform our nowcasts. Cascaldi-Garcia et al. (2024) employed the same idea in the context of nowcasting euro area GDP by supplementing the euro area data with data from the four largest economies: France, Germany, Spain, and Italy. Exploiting the heterogeneity that is present in disaggregated series has also been used in other contexts, including obtaining measures of trend inflation (Garnier et al. 2015, Aydın Yakut 2025) (PDF 10.78MB), and forecasting (Marcellino et al. 2003, Huber et al., 2020). To expand the available information set, we also incorporate high-frequency measures. These include financial market indicators and commodity prices that can provide early signals of changes in economic conditions. The Russian invasion of Ukraine and the recent conflict in the Middle East have demonstrated the importance of commodity prices in driving fluctuations in the headline rate of inflation, and we find that the inclusion of commodity prices is vital for providing early warning of energy price-induced inflation.
Our results illustrate that the model produces accurate nowcasts. We conduct a pseudo real-time nowcasting exercise and find that our model's performance is competitive with Bloomberg nowcasts and inflation fixings, which reflect short-term market-based inflation expectations. In addition, we demonstrate the evolution of our nowcasts over time, showing how the model tracks actual inflation developments. To illustrate the practical value of our approach, we present a case study of the March 2026 inflation spike following the Iran conflict. This episode demonstrates the data flow through our nowcasting framework and highlights how timely nowcasts can provide policymakers with critical information when official data releases are not yet available. In particular, the model captures the impact of higher-than-expected price data for February 2026, as well as the surge in energy prices, allowing us to obtain an accurate early estimate of HICP inflation for March 2026. Finally, our approach enables the decomposition of nowcast changes, providing insights into the sources of short-term price movements in the euro area.
Methodology: A Dynamic Factor Model
The Core Framework
Our nowcasting toolkit uses a dynamic factor model, a statistical framework that identifies common patterns across many economic variables and uses these patterns to estimate inflation. We adopt a block dynamic factor model framework similar to Cascaldi-Garcia et al. (2024).
The model works by combining observed economic variables with underlying latent factors. The observed variables include 47 economic indicators categorised as prices, surveys, financial variables, and commodities. These observed variables are related to a set of unobserved common factors through factor loadings, which measure how strongly each variable responds to each factor. The model also includes an error term to account for variable-specific movements not captured by the common factors. The latent factors follow an autoregressive process of order one. Similarly, the error terms also follow an autoregressive pattern, allowing for persistence in variable-specific movements.
Structuring by Data Type and Timing
Different from Cascaldi-Garcia et al. (2024), who structure their blocks by country, we structure our blocks by data type, whilst incorporating country-level variables within these blocks. We distinguish between four factor blocks: a global factor (G) capturing euro area-wide trends, financial factors (F) reflecting real-time market information, soft factors (S) representing timely survey indicators, and hard factors (H) capturing official macroeconomic releases. This structure allows us to incorporate information as it becomes available whilst respecting the typical release timing of different data types.
The block structure is specifically designed to reflect timing assumptions about how information flows through the economy. Financial variables evolve fast, and therefore the structure allows them to influence the nowcasts for both soft and hard economic data contemporaneously. Likewise, soft survey data, such as PMIs, are released in the reference month, so they provide contemporaneous information about current inflation. Hard data are released with a delay, so the release of this data should not move financial markets or surveys in the current month.
Data
We compile a dataset of 47 variables for the euro area and its largest economies: Germany, France, Italy, and Spain, including hard data, soft indicators, financial variables, and commodity prices. We supplement hard data with soft economic indicators, as well as global commodity price and financial series, to provide a comprehensive view of the information set available to policymakers when making decisions. Our estimation sample spans the period from January 2005 to April 2026. When series are unavailable in earlier periods, their values are imputed using the Expectation Maximisation (EM) algorithm outlined in Bańbura & Modugno (2014). The EM algorithm also allows us to deal with the 'ragged-edge' problem, which is that not all data are released at the same point in time.
Financial market and commodity price data are observed at higher frequency and have been shown to be useful for nowcasting inflation. For example, the Cleveland Fed's inflation nowcasting model uses daily oil prices as one of the key inputs, and Modugno (2013) finds that the inclusion of various commodity prices improves performance. To incorporate this information, we take the average value of the financial variable in the calendar month, up to the date of the nowcast. As we update the nowcast each week, the variable in the first week of the month corresponds to the average of the value in that week, while in the final week of the month, this corresponds to the average value across the entire month.
During back-testing, we use the final release values of the variables as both inputs and targets. While this is clearly an imperfect measure as data are typically subject to revision, it is a feature of euro area data that historic vintages are not readily available. Comparisons with inflation fixings and Bloomberg nowcasts should therefore be interpreted with caution, as these are obtained using data vintages available at the time without access to the revised data releases. That being said, revisions to the series included in our model are infrequent and typically small, so this is unlikely to materially affect the results. To quantify uncertainty around our nowcasts, we construct quantile-based prediction intervals using the empirical distribution of historical errors.
Empirical Results
Model Validation
The historical accuracy of our nowcasts is shown in Figure 1 and Table 1 below. To do so, we conduct a pseudo real-time nowcasting exercise by collecting the release dates for all of the macroeconomic variables used in our model. We then construct weekly datasets until April 2026, where each dataset contains the data that would have been available on the Friday of that given week. In the assessment of model performance, we consider nowcasts for the current calendar month.
Nowcast Tracks Inflation Dynamics Through Volatile Post-Covid Period
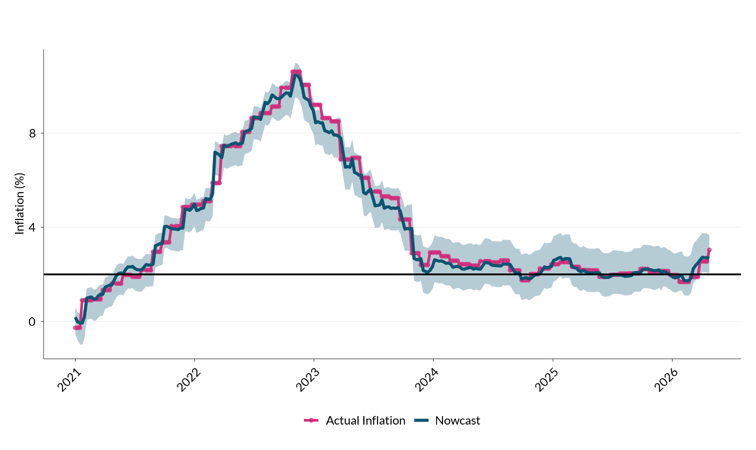
Figure 1: Euro Area Headline Inflation Nowcast (Weekly)
Source: Eurostat and authors' calculations.
Note: The dashed blue line shows the weekly nowcast. The blue shaded band represents the 95% uncertainty bands, constructed using a 156-week (3-year) rolling window of historical forecast errors. The pink line shows the actual inflation rate. The horizontal black line shows 2% inflation rate.
Accessibility: Get the data in accessible format. (CSV 8.3KB)
In the figure, we plot the evolution of our nowcasts from 2021 onwards alongside the official HICP releases to focus on the post-Covid period when inflation dynamics became particularly volatile. As demonstrated by the dashed blue line, our nowcast successfully tracks the sharp inflation spike in 2021-2022 and the subsequent disinflation through 2023-2024. As will be discussed more detailed in the case study, the model captures the recent uptick in early 2026 driven by the escalation of geopolitical tensions. To quantify the uncertainty surrounding our nowcast, we use a similar approach to that outlined in Reifschneider and Tulip (2019), and used by central banks including the ECB Linzenich & Meunier (2024). The approach involves constructing uncertainty bands based on the previous nowcasting errors. While these papers assume errors are normally distributed around the point estimate, we use the empirical distribution of our nowcast errors over the previous 3 years. This accounts for periods where the model may systematically over- or underestimate HICP, particularly during structural breaks or periods with heightened volatility such as the energy crisis of 2022 and the recent conflict in the Middle East.
Table 1: Root Mean Squared Errors (RMSE) by Calendar Year: 2021-2026
| Model | 2021 | 2022 | 2023 | 2024 | 2025 | 2026* |
|---|
| Nowcast | 0.44 | 0.45 | 0.55 | 0.20 | 0.13 | 0.23 |
| Bloomberg | – | 0.44 | 0.26 | 0.24 | 0.17 | 0.29 |
| Inflation Fixings | – | 0.49 | – | – | 0.11 | 0.17 |
Note: * The RMSE for 2026 is calculated from nowcasts using data up to and including 24th April.
Table 1 shows the performance of our model compared to two benchmarks: Bloomberg's nowcasting model, and inflation fixings. Bloomberg's nowcasting model employs a Bayesian Vector Autoregression (BVAR) specified at monthly frequency, incorporating 32 variables for euro area inflation, including headline and core HICP, producer prices, energy prices, commodity prices, and labour market indicators. Alternatively, inflation fixings are market-based measures of current-month inflation expectations derived from inflation derivative contracts traded in financial markets. Unlike nowcasts, which are statistical estimates based on macroeconomic data, inflation fixings incorporate market participants' views on risk and uncertainty. Policymakers closely monitor inflation fixings as they provide a real-time benchmark of market expectations that complements model-based nowcasts. However, since inflation fixings are only available reliably intermittently, we focus our comparison on Bloomberg's nowcasts.
Our model produces nowcasts with similar or smaller RMSEs compared to Bloomberg's nowcasts in all calendar years available for comparison except for 2023. In 2023, Bloomberg's model performs substantially better. One potential explanation is that our model does not include real activity variables, which limits its effectiveness in capturing demand-driven inflation. As noted by Giannone and Primiceri (2024), inflation in 2023 had a large demand-driven component, reflecting robust consumption and tight labour markets rather than supply-side shocks. Additionally, 2023 was an exceptionally volatile year for headline inflation, with large swings driven by base effects and energy price movements. Bloomberg's BVAR model appears better suited to handling such extreme periods by potentially constraining its parameter estimates.
To illustrate the practical value of our nowcasting framework, we present a detailed case study of the March 2026 inflation spike following the recent Middle East conflict, demonstrating how our model provides real-time insights into inflation dynamics when official data releases are not yet available.
Case Study: Nowcasting During the March 2026 Shock
The goal of the nowcasting toolkit is to provide policymakers with a timely assessment of current economic conditions, particularly during periods of heightened uncertainty when official data releases lag behind real-time developments. To illustrate this value, we consider the recent period around the start of the Iran conflict, and the energy-price related inflationary pressure that followed.
Weekly Nowcasts Capture Energy-driven Inflation Surge Ahead of the ECB Meeting in March
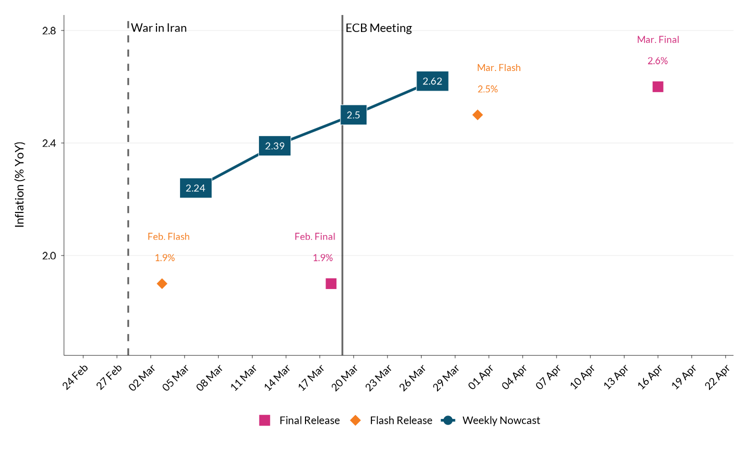
Figure 2: Real-Time Nowcasting During the March 2026 Inflation Spike
Source: Eurostat and authors' calculations.
Accessibility: Get the data in accessible format. (CSV 1.49KB)
In early March 2026, the latest available data showed that euro area headline inflation stood at 1.9% year-on-year, as confirmed by the February flash release published on 3 March. However, geopolitical tensions escalated sharply on 28 February with the intensification of the Iran conflict, triggering a significant surge in global energy prices. Oil prices jumped notably, creating immediate uncertainty about near-term inflationary pressures in the euro area. While the ECB Governing Council's Monetary Policy Meeting was on 19 March, the preliminary flash estimate for March inflation would not be released until 31 March, twelve days after the policy decision. This timing mismatch highlights a key challenge for central banks; as the policymakers should make decisions with incomplete information about current economic conditions.
Our weekly nowcasting model, updated every Friday, provided timely estimates throughout March capturing the energy-driven inflation dynamics in real-time. In early March, before the full impact of the energy shock was reflected in the data, our nowcast was 2.2%, already up from 1.9% in February. By 27 March, as energy price increases propagated through the nowcasting framework, the nowcast had revised upward to 2.6%, reflecting the magnitude of the energy shock. The preliminary flash release on 31 March (2.5%) and the final release on 16 April (2.6%) confirmed the accuracy of our nowcast model. This episode underscores how high-frequency nowcasting can complement official data releases and provide early signals during periods of heightened economic uncertainty.
Nowcast Evolution, March 2026
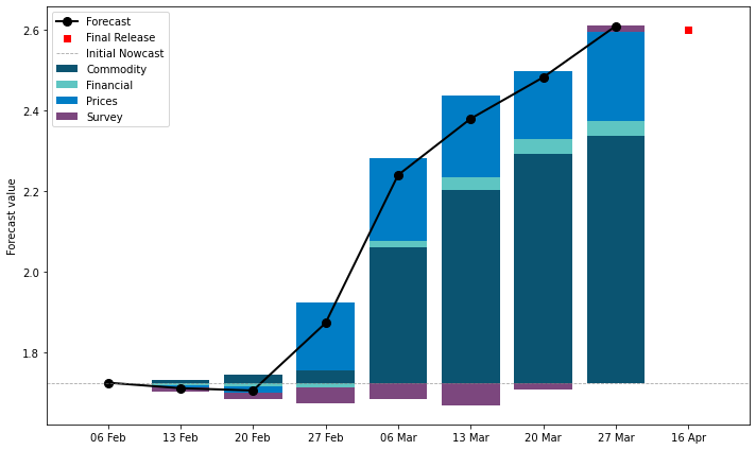
Figure 3: March Nowcast Revisions Driven by Higher Commodity Prices and February Flash Release
Source: Eurostat and authors' calculations.
Accessibility: Get the data in accessible format. (CSV 0.71KB)
Figure 3 demonstrates two key events that led to revisions in our nowcast. First, price data in the euro area and France for February 2026 surprised to the upside. The data for France were released on 27th February, and the effect on the nowcast for March is shown by the positive contribution of the yellow bar in that week. The release of February HICP data for the euro area re-enforced this, with the incoming price data continuing to contribute to higher nowcasts for HICP in March. Second, and more obviously, the conflict in the Middle East, which intensified on 28th February, caused a surge in global energy prices. Our model captures the sharp uptick in inflationary pressures, with the nowcast for March 2026 revised from 1.88% in the week before the conflict, to 2.39% the following week. Our final nowcast for March 2026 was 2.62%, based on data up to the end of 27th March, compared to the final release of 2.60% published in mid-April, demonstrating the usefulness of having a toolkit that can capture changes in close to real-time.
Implications and Next Steps
This Staff Insight introduces a new tool for nowcasting headline inflation in the euro area. To do so, we use a block dynamic factor model, structured by data type and timings. By incorporating data from multiple sources—including hard macroeconomic data, soft survey indicators, financial market variables, and commodity prices—we provide timely estimates of current inflation that are updated weekly. Our model demonstrates competitive performance with Bloomberg's nowcasting framework. Importantly, our approach allows us to decompose nowcast revisions by data category, providing useful information on what is driving inflation dynamics in real-time. The March 2026 case study showed that our model captured the energy-driven inflation spike stemming from the Middle East conflict well before official data releases.
Our analysis demonstrates that commodity price data are important for capturing inflationary pressures generated by supply shocks, such as the Middle East conflict. However, our model's weaker performance in 2023 highlights a limitation: the absence of demand-side variables constrains our effectiveness in demand-driven inflation episodes. Further research could explore the inclusion of a demand block to improve performance in settings with similarities to 2023.
References
Akepanidtaworn, K. & Akepanidtaworn, K. (2025), 'Gdp Nowcasting Performance of Traditional Econometric Models vs Machine-Learning Algorithms', IMF Working Papers 2025(252), 1.
Aria, M., Cuccurullo, C. & Gnasso, A. (2021), 'A comparison among interpretative proposals for random forests', Machine Learning with Applications 6, 100094.
Aydın Yakut, D. (2025), 'Beyond aggregates: A dual lens on eurozone trend inflation', Central Bank of Ireland Research Paper Series 3.
Banbura, M., Giannone, D. & Reichlin, L. (2010), 'Nowcasting', ECB Working Paper No. 1275.
Bańbura, M. & Modugno, M. (2014), 'Maximum likelihood estimation of factor models on datasets with arbitrary pattern of missing data', Journal of Applied Econometrics 29(1), 133–160.
Beck, G., and Carstensen, K., Menz, J.-O., Schnorrenberger, R., and Wieland, E. (2024), 'Nowcasting Consumer Price Inflation Using High-Frequency Scanner Data: Evidence from Germany'. ECB Working Paper No. 2930.
Bok, B., Caratelli, D., Giannone, D., Sbordone, A. M. & Tambalotti, A. (2018), 'Macroeconomic nowcasting and forecasting with big data', Annual Review of Economics 10 (Volume 10, 2018), 615–643.
Cascaldi-Garcia, D., Ferreira, T. R., Giannone, D. & Modugno, M. (2024), 'Back to the present: Learning about the euro area through a now-casting model', International Journal of Forecasting 40(2), 661–686.
Garnier, C., Mertens, E. & Nelson, E. (2015), 'Trend inflation in advanced economies', International Journal of Central Banking 11(4), 65–136.
Giannone, D. & Primiceri, G. (2024), The drivers of post-pandemic inflation, Working Paper 32859, National Bureau of Economic Research.
Huber, F., Pfarrhofer, M. & Piribauer, P. (2020), 'A multi-country dynamic factor model with stochastic volatility for euro area business cycle analysis', Journal of Forecasting 39(6), 911–926.
Knotek, E.S., II and Zaman, S. (2017), 'Nowcasting U.S. Headline and Core Inflation', Journal of Money, Credit and Banking, 49, 931-968.
Linzenich, J. & Meunier, B. (2024), 'Nowcasting made easier: A toolbox for economists', ECB Working Paper No. 2024/3004.
Marcellino, M., Stock, J. H. & Watson, M. W. (2003), 'Macroeconomic forecasting in the euro area: Country specific versus area-wide information', European Economic Review 47(1), 1–18.
Modugno, M. (2013), 'Now-casting inflation using high frequency data', International Journal of Forecasting 29(4), 664–675.
Reifschneider, D. & Tulip, P. (2019), 'Gauging the uncertainty of the economic outlook using historical forecasting errors: The federal reserve's approach', International Journal of Forecasting 35(4), 1564–1582.
Richardson, A., van Florenstein Mulder, T. & Vehbi, T. (2021), 'Nowcasting gdp using machine-learning algorithms: A real-time assessment', International Journal of Forecasting 37(2), 941–948.
Appendix
Table A1: Data-set
| Variable | Category | Block | Transform |
|---|
| EA HICP Headline | Prices | Hard | PC |
| EA HICP Processed Food | Prices | Hard | PC |
| EA HICP Unprocessed Food | Prices | Hard | PC |
| EA HICP Non-energy Ind. Goods | Prices | Hard | PC |
| EA HICP Energy | Prices | Hard | PC |
| EA HICP Exc. Energy and Unprocessed Food | Prices | Hard | PC |
| DE HICP Headline | Prices | Hard | PC |
| FR HICP Headline | Prices | Hard | PC |
| IT HICP Headline | Prices | Hard | PC |
| ES HICP Headline | Prices | Hard | PC |
| EA PPI Industry Exc. Construction | Prices | Prices | Hard |
| EA PPI Capital Goods | Prices | Hard | PC |
| EA PPI Consumer Goods | Prices | Hard | PC |
| EA PPI Durable Goods | Prices | Hard | PC |
| EA PPI Intermediate Goods | Prices | Hard | PC |
| EA PPI Energy Goods | Prices | Hard | PC |
| DE PPI | Prices | Hard | PC |
| FR PPI | Prices | Hard | PC |
| ES PPI | Prices | Hard | PC |
| DE Import Prices Capital Goods | Prices | Hard | PC |
| DE Import Prices Durable Goods | Prices | Hard | PC |
| European Commission Economic Confidence | Surveys | Soft | LIN |
| DE IFO Current Assessment | Surveys | Soft | LIN |
| DE IFO Expectations | Surveys | Soft | LIN |
| FR Business Confidence | Surveys | Soft | LIN |
| DE IFO Business Climate | Surveys | Soft | LIN |
| FR Consumer Confidence | Surveys | Soft | LIN |
| EC Services Confidence | Surveys | Soft | LIN |
| EC Industrial Confidence | Surveys | Soft | LIN |
| PMI Composite - Input Prices | Surveys | Soft | LIN |
| PMI Composite - Output Prices | Surveys | Soft | LIN |
| PMI Services - Input Prices | Surveys | Soft | LIN |
| PMI Services - Prices Charged | Surveys | Soft | LIN |
| DE 5Y5Y forward breakeven | Expectations | Soft | LIN |
| FR 5Y5Y forward breakeven | Expectations | Soft | LIN |
| EA 5Y5Y inflation swap | Expectations | Soft | LIN |
| Markit iBoxx Breakeven Euro-Inflation Index | Expectations | Soft | LIN |
| iBoxx Euro Inflation-Linked | Expectations | Soft | LIN |
| Generic 1st TTF Natural Gas Base Load Futures | Commodities | Financial | LIN |
| Netherlands TTF Natural Gas Forwards | Commodities | Financial | LIN |
| Generic Natural Gas, EU Henry Hub | Commodities | Financial | LIN |
| Generic Crude Oil Future, Brent | Commodities | Financial | LIN |
| Generic Wheat | Commodities | Financial | LIN |
| Generic Corn | Commodities | Financial | LIN |
| Generic Soybean | Commodities | Financial | LIN |
| European Commission Gasoline Prices | Commodities | Financial | LIN |
| Bloomberg Commodity Index | Commodities | Financial | LIN |
Source: Bloomberg, ECB SDW, Eurostat, Ifo Institute, National Institute of Statistics and Economic Studies
Note: PC: year on year percentage change, LIN: linear, no transformation.
Table A2: Root Mean Squared Errors (RMSE) by Calendar Year: 2021-2026, Alternative Specifications
| Model | 2021 | 2022 | 2023 | 2024 | 2025 | 2026* |
|---|
| Benchmark Nowcast | 0.44 | 0.45 | 0.55 | 0.20 | 0.13 | 0.23 |
| Nowcast with PMIs | 0.42 | 0.46 | 0.57 | 0.17 | 0.15 | 0.23 |
| Nowcast No Commodities | 0.46 | 0.66 | 0.62 | 0.22 | 0.14 | 0.31 |
| Nowcast No Countries | 0.45 | 0.46 | 0.57 | 0.17 | 0.17 | 0.23 |
| Nowcast Diagonal Block | 0.40 | 0.49 | 0.62 | 0.19 | 0.16 | 0.25 |
Endnotes