Robert Kelly, Chief Economist, Central Bank of Ireland
What is the outlook for the Irish economy?
The Middle East conflict has been pushing energy prices higher, worsening the inflation outlook and affecting household spending.
However, exceptionally strong business investment, particularly in AI and data centres, is offsetting these headwinds.
This has led to us revising our domestic growth forecast upwards to 3.3 per cent for 2026 and in the region of 3 per cent annually out to 2028.
The reported Middle East peace deal would materially improve the inflation outlook.
However, the economy must still absorb existing shocks. For example, food prices will continue reflecting higher fertiliser costs as this year's crops mature.
If the peace deal doesn’t hold and creates prolonged energy disruptions, inflation could approach 5 percent and push domestic growth below 2 percent next year.
What does the economic outlook mean for government spending and taxation?
Ireland's national development plan faces new cost pressures as construction prices rise sharply.
Prioritising investment in digital infrastructure, roads and energy networks could help offset rising costs, attract private business investment, and strengthen Ireland’s long-term competitiveness.
More broadly, over the last five years, public spending has grown by nearly 10 per cent per year. This is well above the rate the economy can sustain, and it is set to continue at a strong pace.
This spending growth is increasingly being financed by excess corporation tax. A sudden decline in these tax revenues could create a 13.5 billion euro shortfall in the public finances by 2028.
With so many competing demands, an effective fiscal anchor would enable policy flexibility while preventing uncontrolled spending growth.
Find out more:centralbank.ie/QB
Comment
The global economy continues to face challenges and heightened uncertainty arising from the conflict in the Middle East, with the disruption in the Strait of Hormuz continuing into its fourth month. Going in the other direction, continued AI-related capital investment has supported global economic activity, and this has also been evident in the Irish economy. Even when the conflict is fully resolved the restoration of supply chains will take an extended period. Accordingly, there has been exceptional volatility in spot oil prices alongside related commodities and more persistent challenges to supply leading to a higher outlook for energy prices generally. For Ireland, higher energy costs are eroding household real incomes and dampening consumer confidence, while also feeding through to broader inflationary pressures. The conflict poses complex risks to global supply chains beyond energy, with potential downstream effects on production costs and economic activity. Against this backdrop, domestic economic policy faces the dual challenge of supporting those most vulnerable and enabling households and firms build resilience to these shocks generally, while avoiding measures that unnecessarily add to demand or entrench inflationary pressures within the economy.
These developments have led to material changes to the economic outlook that prevailed before the conflict, with somewhat divergent views on consumer spending and business investment, especially in 2026. Modified domestic demand (MDD) growth is projected to moderate, reflecting the damping effects of higher energy prices on real incomes and consumption. However, the momentum in MNE-led investment is expected to be significant in contributing to overall MDD growth over the forecast horizon. Inflation forecasts have been revised upwards notably, to 3.5 per cent this year and 2.9 per cent in 2027, with the outlook for energy prices substantially higher than assumed in the March Bulletin. However, uncertainty around these baseline projections is exceptionally high, and risks remain firmly tilted to the downside for growth and to the upside for inflation.
Given the scale of uncertainty, this Bulletin presents alternative scenarios to illustrate the range of possible outcomes. In the milder scenario, where the conflict is resolved swiftly, oil and gas prices fall below those expected in our baseline forecast, supporting slightly stronger growth and lower inflation. However, even in this scenario, the effects of the disruption already experienced since the start of the war continues to exert upward pressure on inflation relative to what was expected prior to the conflict. In the severe scenario, energy and food commodity prices are assumed to remain persistently higher, inflation would reach materially elevated levels, approaching 5 per cent in 2027, while growth would slow significantly. Beyond direct energy price impacts, the conflict also presents broader global supply chain implications (Box C). Energy-intensive products produced in the Gulf region, such as fertilisers and helium—the latter a critical input in semiconductor fabrication—have seen sharp price increases with downstream implications for consumer prices. An escalation could trigger more extensive disruptions not fully captured in the scenarios published in this Bulletin. These effects differ markedly across sectors: multinational enterprises face heightened uncertainty around input costs and export demand, while indigenous firms may have more limited ability to absorb rising input costs, and households are more directly exposed to cost-of-living pressures.
Against this uncertain backdrop, the preliminary national accounts data for Q1 2026 epitomised the dual nature of the Irish economy. MDD grew strongly, heavily influenced by multinational-dominated investment, particularly in AI and data centre-related capital goods. In contrast, headline GDP contracted sharply during the quarter, reflecting base effects from the volatile swings in exports of polypeptide hormones last year and a contraction in offshore goods trade. These divergences underscore the necessity of looking beyond headline measures to understand underlying momentum in the domestic economy.
MNEs continue to play an outsized role, not only in investment and exports, but also in tax revenues, while they are prominent in the labour market as well. The pharmaceuticals and ICT sectors have been significant drivers of employment growth in recent years, particularly for workers with advanced qualifications (Box B). The share of workers with tertiary-level qualifications has increased substantially over the past decade, partly driven by these MNE sectors. The sectors differ markedly in international recruitment patterns, with ICT relying more heavily on workers from beyond the EU. These sectors also contribute disproportionately to corporation tax revenues, with ICT and pharmaceuticals together accounting for over half of all CT revenue, up sharply since 2019. This concentration creates significant fiscal vulnerabilities, particularly given volatility and uncertainty around future investment and employment trends in these globally mobile sectors.
The strength in MDD through 2025 and into early 2026 was underpinned by robust investment, particularly in AI and data centre-related activity. AI-linked data centre hardware imports have surged in recent years to represent over half of modified machinery and equipment investment (Box A). The scale of this investment activity, combined with strong overall employment growth in recent years, has maintained the economy performing at close to its potential by early 2026. However, the labour market is now showing signs of softening. Employment growth is moderating, job postings have continued to decline, and the unemployment rate has increased marginally. Expectations around real wages have declined, with nominal wage growth not expected to keep pace with inflation in the near-term, contributing to a deterioration in consumer confidence. Personal consumption growth is expected to be more subdued as higher energy prices continue to erode real household disposable incomes. This represents a different context compared to the previous energy price shock following the Russian invasion of Ukraine, when the labour market was tightening, adding to nominal wage growth at that time.
Energy price growth has been revised upward sharply following increases in wholesale oil and gas price assumptions and announced utility price rises. Direct effects are clearly visible in headline inflation, with energy contributing significantly. However, there is also evidence of indirect effects as higher energy costs feed through to production costs across goods and services, with transport costs increasing and prices for energy-intensive products rising sharply. Services inflation has remained elevated, partly reflecting the pass-through of higher input costs but also continued domestic demand and wage pressures. The key risk is the potential for second-round effects to emerge, whereby workers seek compensation for real wage erosion through higher nominal wage demands, and firms pass through these higher labour costs to consumer prices to maintain profit margins. While there is no evidence of widespread second-round effects to date, the risk remains significant, particularly if the energy shock proves more persistent or if the conflict escalates further.
At the euro area level, monetary policy has responded to heightened inflationary pressures to ensure euro area inflation stabilises sustainably at the 2 per cent medium-term target. In June, the ECB Governing Council raised its three key interest rates, by 25 basis points. The policy tightening is motivated by the sharp increase in energy prices and their indirect effects on broader inflation. The Governing Council’s policy deliberations remain data-dependent, with the Council continuing to assess incoming information on a meeting-by-meeting basis.
From a domestic policy perspective, the priority must be to strengthen the resilience and sustainability of the public finances while supporting the economy's adjustment to the energy shock. As highlighted in a Signed Article (PDF 1.01MB) accompanying this Bulletin, recent years have seen substantial increases in recurring government expenditure alongside a growing dependence on corporation tax, which now accounts for nearly one-quarter of total government revenue. When estimated excess corporation tax is excluded, the underlying budget deficit has increased substantially. Expenditure growth has exceeded initial budget plans over the last five years resulting in overall government spending growing at rates well above what would be consistent with the economy's estimated sustainable capacity. The absence of an effective fiscal anchor remains a significant concern. Committing to a credible expenditure rule that aligns spending growth with the economy's trend growth rate is essential for establishing effective counter-cyclical fiscal policy and placing the public finances on a sustainable path. This is particularly important given structural pressures from population ageing, infrastructure needs, and vulnerabilities from tax base concentration. With the economy operating close to capacity, budgetary policy should not add further demand stimulus at present. Any additional support measures for vulnerable households should be targeted and tailored, and accommodated within existing budgetary allocations. At the same time, addressing vulnerabilities from the narrow tax base would be complementary to maintaining macro-financial stability, with a broad range of possibilities from reviewing tax reliefs, consumption and property taxes and social insurance contributions among the feasible options.
Beyond fiscal discipline, addressing supply-side constraints remains critical for supporting sustainable growth and improving living standards. The economy faces binding constraints in housing, energy, water and wastewater, and transport infrastructure. These constraints are limiting current economic activity and reducing the economy's potential growth rate. Measures that reduce fossil fuel dependency would represent more sustainable support, helping to build resilience against future geopolitical shocks while contributing to emission reduction targets. A higher investment rate by households and indigenous firms being crowded in through appropriately funded and well prioritised public capital spending would sustainably support long-term growth. Planned expenditure under the National Development Plan is designed to address these shortages, and reforms such as those outlined in the Accelerating Infrastructure Report and Action Plan are welcome. However, translating these plans into actual delivery will require sustained effort, effective project management, and willingness to address longstanding bottlenecks. With economic conditions still relatively favourable despite recent headwinds, a window of opportunity exists to improve the resilience of the public finances and the economy to the structural pressures and external shocks that lie ahead.
Outlook for the Irish Economy
Recent Developments and Forecast Summary
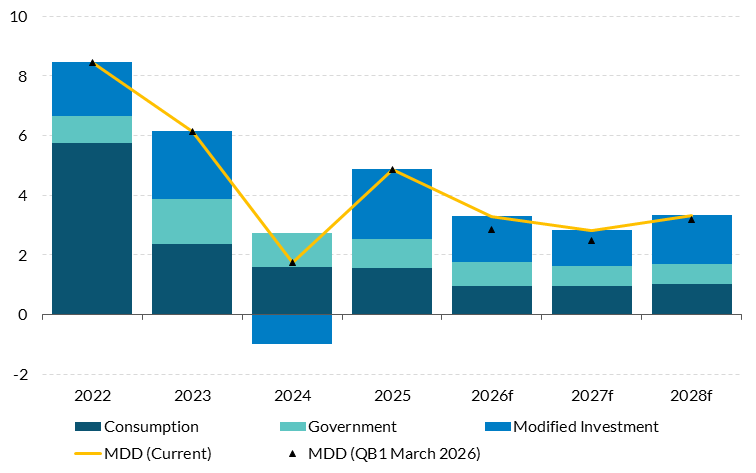
Continued strength in investment underpinned growth in Modified Domestic Demand (MDD) in the first quarter of 2026, though growing indications of a slowdown were evident in other more domestically-oriented indicators. Economic activity (Modified Domestic Demand) expanded by 4.3 per cent in Q1 2026 compared with the same quarter in 2025 (Figure 1). This strong pace of growth comes on the back of continued strength in modified investment, particularly related to AI and data centres by multi-nationals. Domestic building and construction investment increased by 4.9 per cent while multinational-dominated modified machinery and equipment increased by 16.6 per cent in the first quarter. More domestically oriented and less volatile indicators of growth in the Irish economy also point to continued growth in the first quarter of 2026 but suggest that the pace of growth is slower than indicated by headline MDD (Figure 2). Output of domestically-oriented sectors increased 1.4 per cent and growth in non-corporation tax revenue slowed to 5.5 per cent in the first five months of the year, down from 6.4 per cent for the same period last year. Consumption continued to grow at a steady rate of 2.6 per cent year-on-year in Q1, although recent retail sales and card payment data for April suggest a slight slowdown in consumer spending at the start of Q2, as the conflict in the Middle East may be becoming more evident in the data (Figure 11). The labour market picture is more complicated. The Labour Force Survey indicates no job growth in the first quarter relative to the previous year, a marked slowdown, while monthly payrolls do not indicate such a sharp slowdown in employment growth and unemployment has remained below 5 per cent. The Central Bank’s Business Cycle Indicator (BCI) summarises the information from the latest high-frequency monthly data, separating out the underlying trend in activity from movements due to noise. The latest BCI estimates indicate that the economy hovered around its long-run average rate of growth in Q1, but with a notable weakening in March and April. The main negative contributions to the BCI in March and April were traditional sector output, PMIs and weaker labour market data.
MDD grew strongly in the first quarter of 2026 on the back of modified investment, with consumption remaining steady
Figure 1: Contributions to year-on-year change in Modified Domestic Demand (MDD), (p.p.)
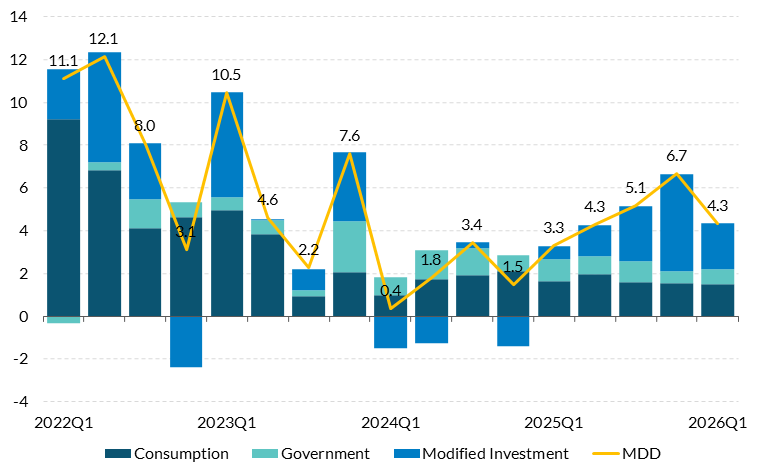
Source: CSO. Chart data in accessible format. (XLSX 164.97KB)
The BCI remained around its long-run average in Q1, but weakened in April
Figure 2: Business Cycle Indicator and Contributions, Average growth = 0
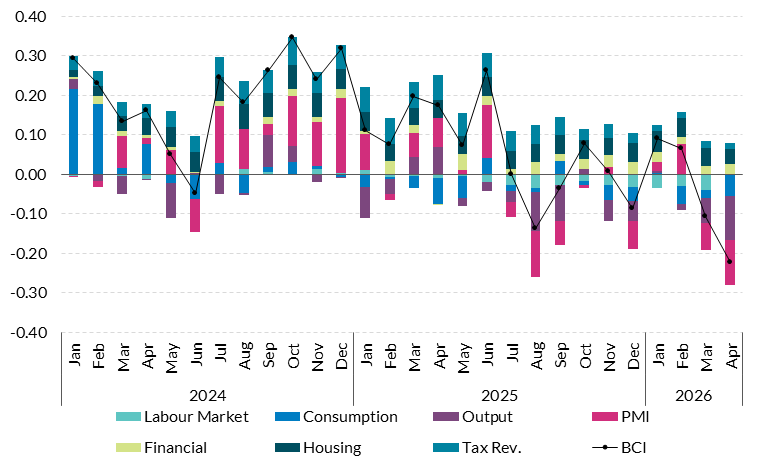
Source: Central Bank of Ireland. Chart data in accessible format. (XLSX 164.97KB)
Note: Details on the methodology underpinning the BCI available here (PDF 790.91KB). The zero axis corresponds to the long-run average historical growth rate in realised MDD. Deviations above or below zero therefore signify that activity is growing faster/slower than its historical average rate.
GDP fell by 17.1 (12.1) per cent year-on-year (quarter-on-quarter) in 2026 Q1, driven by a sharp drop in both polypeptide-hormone exports and net trade related to offshore goods. This was a significant negative surprise relative to the flash estimate of a 6 per cent decline released in April 2026. The reasons for the decline are concentrated in the pharmaceutical sector. Most of the year-on-year drop in GDP is explained by a sharp fall in both cross-border goods exports (which were exceptionally large in the first quarter of 2025) and MNE-related offshore net trade. The former is driven by the dynamics of exports of polypeptide hormones, a key component of weight-loss drugs, which were extremely volatile through 2025. While a large negative contribution to GDP growth due to 2025 base effects was expected, a disconnect between the volume and value of polypeptide hormone exports in March also contributed to the magnitude of the change (Figure 17). In addition, net trade related to offshore goods (merchanting and contract manufacturing), for which information is limited for the CSO flash estimate, both made large negative contributions to quarter-on-quarter GDP growth.
GDP fell sharply in the first quarter of 2026, highlighting its sensitivity to the (onshore and offshore) activities of a small number of multinational enterprises
Figure 3: Contributions to year-on-year change in Gross Domestic Product (GDP), (p.p.)
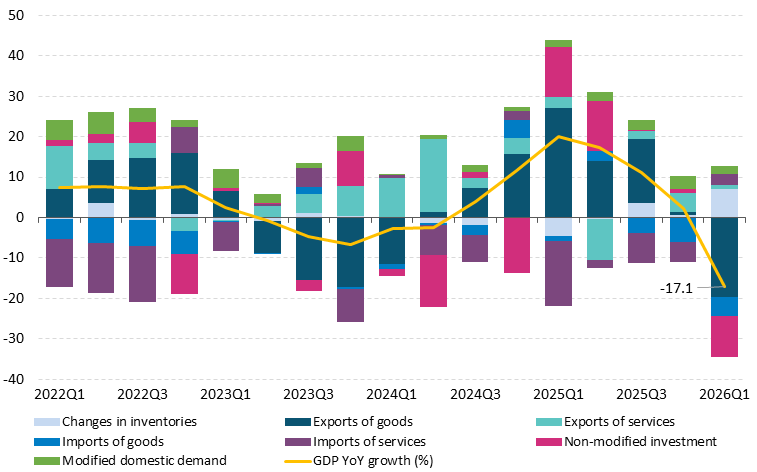
Source: CSO. Chart data in accessible format. (XLSX 164.97KB)
Headline inflation has picked up since March, driven by rising energy prices. Headline HICP increased, on a year-on-year basis, to 3.5 per cent in May with core inflation remaining stable at 2.8 per cent. Energy prices rose sharply in recent months, with April and May, recording increases of 15.3 per cent and 11.9 per cent respectively, contributing more than one percentage point to headline inflation. This pronounced upward momentum in energy prices stems primarily from liquid fuels (see Figure 4). Non-energy industrial goods (NEIG) showed a slight pickup in inflation in the first quarter, though food and services inflation remain stable so far. Underlying inflation measures have edged upwards, remaining above pre-pandemic levels.
Headline inflation rose in recent months, driven by energy price increases as a result of conflict in the Middle East
Figure 4: Contributions to headline inflation (year-on-year per cent change)
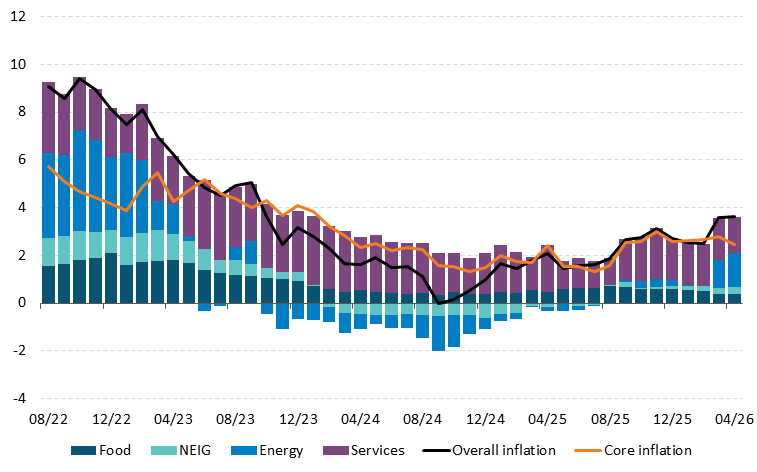
Source: CSO and Central Bank of Ireland. Chart data in accessible format. (XLSX 164.97KB)
Energy prices rose sharply in Q1 2026 driven by strong surge in Liquid Fuels
Figure 5: Contributions to energy inflation
Year-on-year per cent change (%)
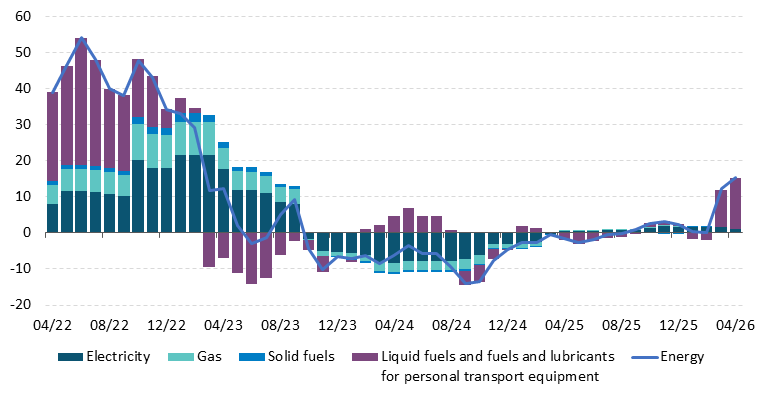
Chart data in accessible format. (XLSX 164.97KB)
Modified domestic demand is projected to continue growing strongly, largely supported by investment, offsetting weakness in consumption due to higher energy prices. The central forecast is based on an assumed market-implied path for oil and gas futures prices as of mid-May 2026. The assumptions regarding the impact of the war on energy prices have been revised upwards since the previous Bulletin. Oil prices in particular are assumed to be 30.2 per cent higher on average in 2026 than in the March 2026 Bulletin assumptions, and 55 per cent higher than in the December 2025 Bulletin (Figure 6). Gas price assumptions for 2026 are up 12 per cent since the previous Bulletin, and 54 per cent since the December 2025 Bulletin. Driven by higher energy costs, projected inflation has been revised upwards to 3.5 per cent in 2026 and 2.9 per cent in 2027. This represents a revision from the previous Bulletin of 0.6 and 0.3 percentage points over the 2026 and 2027 period respectively (Figure 8). Higher inflation has prompted knock-on downward revisions to households’ real disposable income and consumption for 2026. On the other hand, the outlook for modified investment has improved, building on the momentum and broad-based growth in 2025. AI and data-centre related investments in particular are playing an increasingly important role (see Box A). The result is that overall MDD growth is being revised up marginally in 2026 and 2027, to 3.3 and 2.8 per cent respectively (Figure 7). The central projections are sensitive to the assumed path of energy prices and realised outturns on investment and imports of AI and data-centre related capital goods. An escalation of the conflict in the Middle East resulting in higher energy prices than assumed in the central forecast would lead to higher inflation and weaker growth (see Balance of Risks to the Outlook).
Further upward revision to energy price assumptions since the March 2026 projections
Figure 6: Energy price assumptions, QB2 2026 (June) and QB1 2026 (March) versus December 2025, annual percentage change
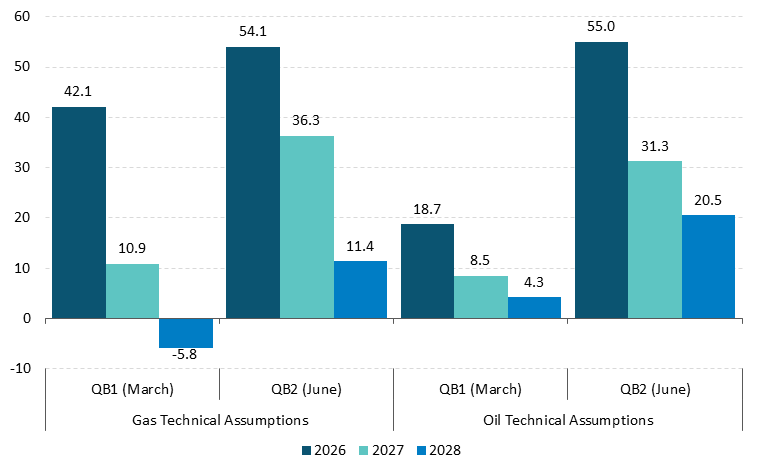
Source: ECB. Chart data in accessible format. (XLSX 164.97KB)
Note: The Synthetic Energy Commodity Price Index (SECPI) is a weighted average of oil and gas prices both expressed in USD/MWh.
MDD growth revised up on basis of strong investment offsetting somewhat weaker consumption due to high energy prices
Figure 7: Contributions to annual change in MDD (per cent)
Source: CSO, Author’s Calculations. Chart data in accessible format. (XLSX 164.97KB)
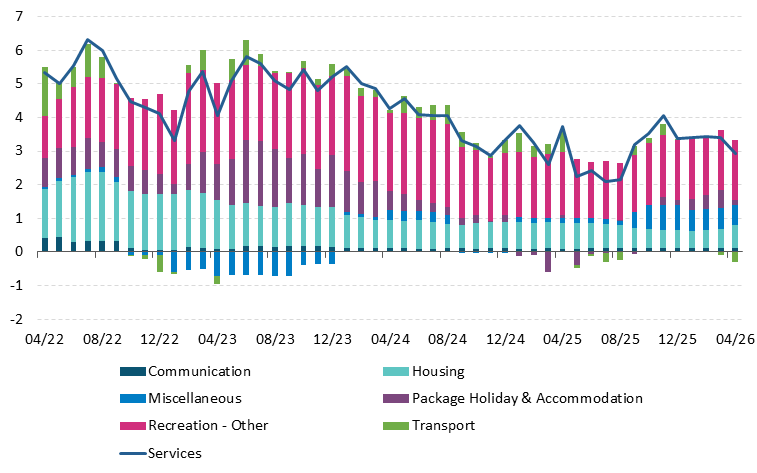
Energy prices and services drive headline inflation higher, projected to reach 3.5 per cent in 2026
Figure 8: Contributions to annual change in headline inflation (per cent)
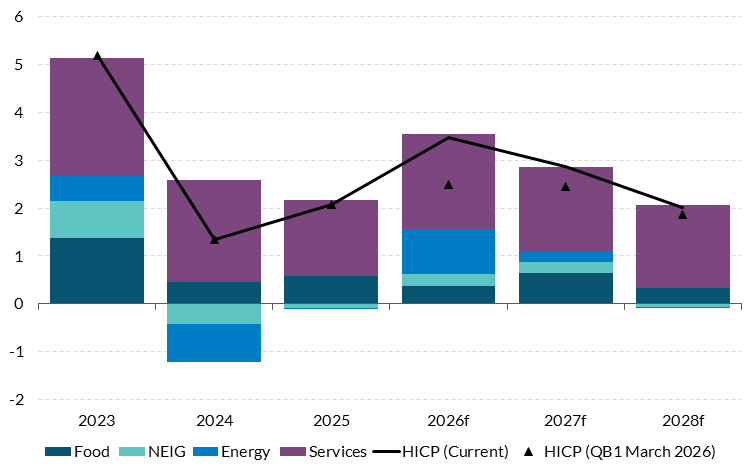
Source: CSO and Central Bank of Ireland. Chart data in accessible format. (XLSX 164.97KB)
Volatility in goods exports is likely to continue in 2026, but overall net trade is projected to contribute positively to economic activity out to 2028. Consistent with the large drop in goods exports in Q1, merchandise exports are expected to fall overall in 2026 following the exceptional rise in 2025 due to exports of weight-loss related pharmaceuticals. However, there is significant uncertainty around the baseline projection (see Balance of Risks to the Outlook). Stripping out volatility associated with weight-loss pharma exports, solid global demand for the main outputs of the Irish pharma sector and the expected opening of new manufacturing capacity, contribute to the projection of sustained growth in merchandise trade out to 2028. Relative to 2025, exports are expected to rebalance towards services, with the latter also forecast to see robust growth on the back of strong ICT-related exports. Overall net exports of goods and services produced in Ireland is forecast to make a negative contribution to GDP growth in 2026, before turning positive out to 2028. Combined with the outlook for domestic demand, this underpins the forecast for growth in real modified national income (GNI*) of 3 per cent per annum on average from 2026 to 2028, slightly below the average expected growth in MDD over the same period (Table 1). The modified current account (CA*) is expected to remain in surplus throughout the forecast horizon.
Risks to the growth outlook remain firmly tilted to the downside, with significant uncertainty around the baseline. The first major source of uncertainty is the duration and severity of the conflict in the Middle East, with the Strait of Hormuz still mostly closed at the time of writing. The Balance of Risks to the Outlook considers adverse and severe scenarios in which energy and food commodity prices remain higher for longer relative to baseline assumptions. This would increase inflation and reduce growth in Ireland. Of note given the large drop in 2026 Q1 GDP, considerable uncertainty surrounds the path of exports and imports, due both to the inherent volatility of the recent onshore export/import drivers (polypeptide hormone exports and AI-related imports) as well as the offshore components of contract manufacturing and merchanting. Over the medium term, there are downside risks to Irish exports and corporation tax receipts if the US changes its corporate tax or industrial policy stance, with potential knock-on effects on investment and incomes. In addition, the pace of developments in AI-related technologies is extremely fast, though there is a lot of uncertainty about the nature and magnitude of their economic impacts, both in Ireland and globally. Finally, a further risk is that capacity constraints could become worse if progress on alleviating infrastructure gaps in the economy is delayed or inadequate.
Table 1: QB2 June 2026 Forecast Summary and Revisions from March 2026 Baseline Projections
| | 2024 | 2025e | 2026f | 2027f | 2028f |
|---|
Constant Prices | | | | | |
| Modified Domestic Demand | 1.8 | 4.9 | 3.3 | 2.8 | 3.3 |
| Modified Gross National Income (GNI*) | 4.8 | 4.7 | 2.4 | 3.0 | 3.5 |
| Gross Domestic Product | 2.6 | 12.3 | -2.7 | 6.5 | 4.0 |
| Total Employment | 2.7 | 2.2 | 1.2 | 2.0 | 1.8 |
| Unemployment Rate | 4.3 | 4.7 | 5.1 | 5.2 | 5.2 |
| Harmonised Index of Consumer Prices (HICP) | 1.3 | 2.1 | 3.5 | 2.9 | 2.0 |
| HICP Excluding Food and Energy (Core HICP) | 2.3 | 2.0 | 3.0 | 2.8 | 2.3 |
Revisions from previous Quarterly Bulletin (percentage points) | | | | | |
| Modified Domestic Demand | 0.0 | 0.0 | 0.4 | 0.3 | 0.1 |
| Gross Domestic Product | 0.0 | 0.0 | -4.0 | 2.2 | -1.2 |
| HICP | 0.0 | 0.0 | 0.6 | 0.2 | 0.1 |
| Core HICP | 0.0 | 0.0 | 0.6 | 0.3 | 0.1 |
Forecast Detail
External Environment
The continued closure of the Strait of Hormuz, now in its fourth month, is having persistent negative effects on the world economy. The closure is causing significant disruption to the world economy by restricting the supply of oil and liquified natural gas (as well other important commodities, such as fertilizer, see Box C). Several emerging market economies have already started implementing policies to contain the demand for fuels, including, in some cases, rationing. In advanced economies, including the net energy-importing euro area, consumers have seen the increase in energy prices adversely affecting their purchasing power. OECD projections predict that global GDP growth will fall this year to 2.8, a reduction of 0.6 percentage points compared to the forecast before the start of the conflict. The sharp rise in energy prices has led to a resurgence in inflation (e.g., inflation reached 3.2 per cent in the euro area and 4.2 per cent in the US in May).
Despite the oil shock, major world economies continue to grow. Optimism about the impact of AI, combined with extraordinary levels of AI-related investment, have propelled the US stock market to new highs and provided a large boost to the US economy. The continued strong performance of US growth depends however on the eventual materialisation of AI-related productivity gains. US GDP grew at an annualised rate of 1.6 per cent (0.4 per cent Q-on-Q) in the first quarter, over half of which was due to growth of investment in information-processing equipment. Robust consumption growth, especially among wealthier households, can also in large part be attributed to the strength of the stock market. Meanwhile, monthly real income growth has been negative since March, as a result of the rise in fuel prices, while the unemployment rate has remained steady at around 4.3 per cent. The euro area economy grew by 0.2 per cent in Q1 2026 (using Irish MDD; it dropped by 0.2 per cent when using Irish GDP due to multinational activity), supported by consumption and investment, and broadly in line with previous quarters as the war in the Middle East only partially affected Q1. While expected to continue showing relative resilience in the face of current external shocks (partly reflecting a pickup in defence spending), challenges of relatively low productivity growth, increasing competitive pressures and strategic dependencies (including on imported fossil fuels), and an ageing population weigh on the longer-term growth prospects. The Chinese economy, which has been relatively insulated from the oil price shock to date given large stockpiles of oil, continued to expand, recording GDP growth of 5 per cent year-on-year in Q1. This growth however continues to be heavily dependent on international trade amid persistent weakness in domestic demand: while exports grew by 19.4 per cent year-on-year in May (imports grew 27.4 per cent but the trade surplus expanded), retail sales rose by a mere 0.2 per cent and house prices fell by 3.5 per cent annually in April, reflecting poor consumer confidence and stagnant demand.
Staff macroeconomic projections for the euro area (June 2026) were revised to reflect a stronger and more persistent than anticipated energy price shock. Eurosystem staff project euro area HICP inflation to average 3.0, 2.3, and 2.0 per cent in 2026, 2027 and 2028, respectively, representing significant upwards revisions for this year and next (by 0.4 and 0.3 per cent) due mainly to a higher path for energy prices. Real GDP growth forecasts over 2026 and 2027 were each trimmed by 0.1 per cent to 0.8 and 1.2 per cent, due to a stronger impact of the war on real incomes and confidence, while the 2028 forecast was slightly raised to 1.5 per cent. Uncertainty surrounding the baseline forecast remains very high, and risks remain tilted to the downside for growth and to the upside for inflation. In response to the inflationary pressures from the war in the Middle East, the ECB Governing Council decided in June to raise its three key interest rates by 25 basis points, bringing the deposit facility rate to 2.25 per cent. The Governing Council considers this move as robust across a range of scenarios mapping out how the shock might evolve and affect the medium-term outlook for the euro area. This leaves the Council well-positioned to navigate the current uncertainty generated by the war. The Governing Council will remain data-dependent in future decisions and is not pre-committing to any rate path.
Economic Activity
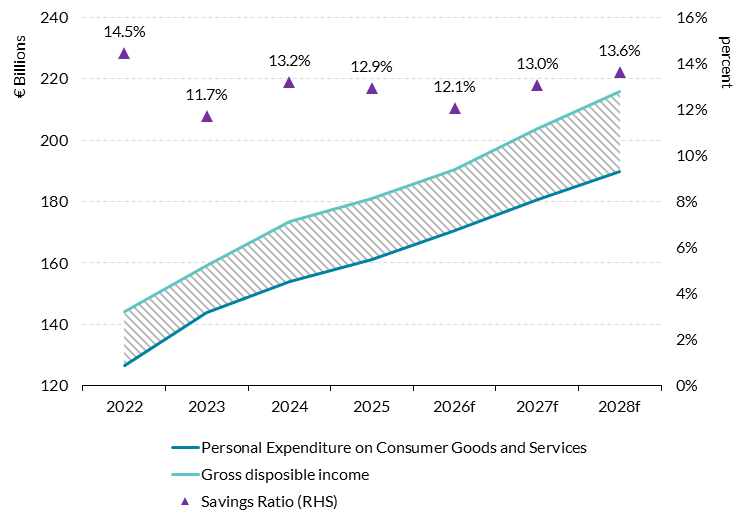
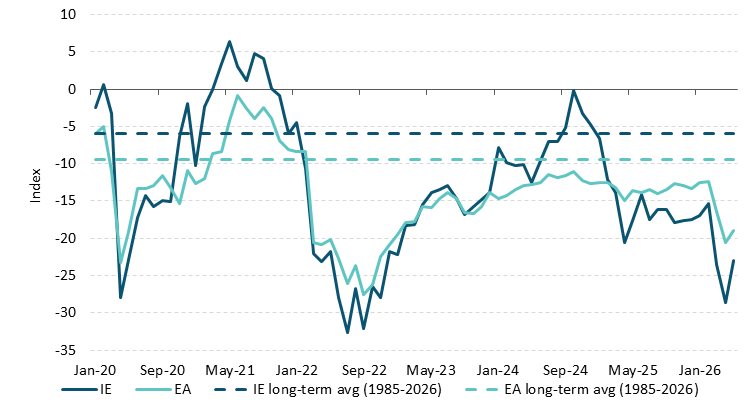
Despite strong outturns for the first quarter of the year, the forecast for consumption has been revised down from the projections in the previous Bulletin, largely due to higher-than-expected inflation lowering real income growth. Consumption is forecast to grow by 1.8 per cent in 2026 before increasing to 1.9 per cent in 2027 and 2.0 per cent 2028. This marks a small downward revision for 2026 from 1.9 per cent in the previous Bulletin. The downward revision stems from two mostly offsetting factors. On the one hand, higher inflation from energy prices is resulting in a decline in real household disposable income, and additional indicators point to a weaker labour market than previously forecast. On the other hand, 2026 Q1 consumption was strong, slightly above expectations from the previous Bulletin, though these were largely unaffected by the conflict in the Middle East which only began in March. High-frequency measures of consumption, which remained stable for the first quarter, have started showing some signs of weakening in April (Figure 11). The downward revision to consumption is less than the downward revision to employment and incomes, resulting in a lower savings rate relative to the previous Bulletin – now averaging 12.9 per cent from 2026 to 2028. Households are expected to temporarily save less to sustain consumption during the spike in energy prices. From 12.9 per cent in 2025, the savings ratio is forecast to fall to 12.1 per cent in 2026, before recovering to above 13 per cent as inflation normalises over the forecast horizon. Consumer confidence in Ireland has fallen over the last six months, from -17.5 in December to -28.6 in April before a slight pick up to -23 in May, in line with the euro area. Data from the ECB Consumer Expectations Survey (CES) showed a decline in expected incomes between February and April 2026, similarly observed in other euro area countries.
Savings rate expected to dip in 2026 as households deal with higher costs
Figure 9: Consumption, gross disposable income and the savings ratio (RHS)
Source: CSO and CBI calculations. Chart data in accessible format. (XLSX 164.97KB)
Consumer confidence had been declining in Ireland, with a small pick-up in May
Figure 10: Consumer confidence index for Ireland and the euro area
Source: European Commission and CBI calculations. Chart data in accessible format. (XLSX 164.97KB)
Latest observation May 2026.
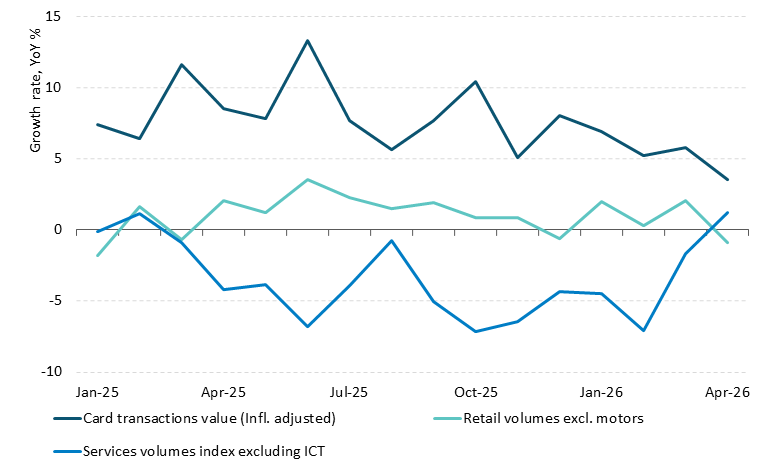
Higher frequency indicators of consumer spending were relatively stable for the first quarter of the year, but the April data showed signs of deterioration. The total value of card payments (in inflation-adjusted terms) has trended gradually downwards since mid-2025 but remained resilient up to and including March 2026, before falling slightly in April (Figure 11). Retail volumes remained relatively stable over the same period, before observing a similar decline in April, as a higher inflation rate may be showing early signs of affecting spending behaviour. In March and April, retail spending on fuels outpaced volumes significantly, consistent with rising energy prices. The monthly services turnover index (excluding ICT) fell over the course of 2025 but improved in consecutive months in March and April 2026 compared to the same months of the previous year. In summary, high-frequency consumption indicators indicate relatively resilient consumption so far in 2026, with a slightly negative turn in April for retail sales and card transactions. The impact of higher energy prices is expected to exert a continued downward pressure on consumption over the remainder of the year.
High-frequency consumption measures show some early signs of weakening in April 2026 after a strong start to the year
Figure 11: High frequency measures relating to consumer spending
Source: CSO and Central Bank of Ireland. Chart data in accessible format. (XLSX 164.97KB)
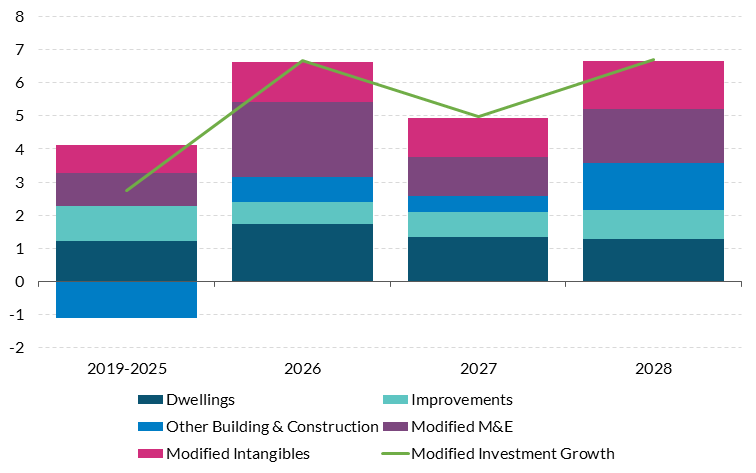
Modified investment is expected to continue building on the strong momentum experienced through 2025. Overall, forecasts for modified investment have been revised upwards from the previous Bulletin to an average of 6.1 per cent from 2026 to 2028 (Figure 12). This is largely due to recent outturns suggesting a substantial pickup in machinery and equipment (M&E) investment by multinational enterprises, led by significant increases in AI and data centre-related spending (see Box A). Despite significant uncertainty in the external environment, these multinational-dominated components of investment (machinery and equipment and modified intangibles) surprised on the upside in 2025 and have built further on this momentum so far in 2026. Imports of machinery and equipment increased by 45 per cent year-on-year in Q1 2026, driven by a substantial increase in office machines and data processing equipment (up 126 per cent year-on-year) and telecommunications equipment (up 68 per cent year-on-year). Modified M&E is forecast to grow by an average of 7.3 per cent over the forecast horizon. Following strong growth in 2025, modified intangibles are also forecast to increase by an average of 6.4 per cent over the same period. However, these components of modified investment are dependent on the activities of a small number of large foreign-owned firms and are therefore particularly (and potentially increasingly), volatile.
Modified investment growth is projected to be broad-based.
Figure 12
Y-o-Y Growth Contributions
Source: CSO and Central Bank of Ireland. Chart data in accessible format. (XLSX 164.97KB)
Projections of housing investment are in line with the previous Bulletin. With the Q1 2026 outturn coming in only marginally stronger than anticipated, housing completion forecasts remain unchanged at 40,000, 43,000 and 46,000 for 2026, 2027 and 2028, respectively. This is subject to improvements in dealing with infrastructural constraints referred to in previous Bulletins. The pool of uncommenced permissions grew throughout 2025 and currently stands at approximately 42,000. Continued improvements in viability as captured by the new house price to construction cost index (which increased by 3.7 per cent year-on-year in Q1 2026) suggest that an increasing portion of these uncommenced permissions might become viable (Figure 13). While the March 2026 Wholesale Price Index indicated only a slight acceleration in costs of 2.6 per cent year on year, the PMI input cost sub-index did rise substantially, indicating that producers are concerned about rising costs due to high energy prices. Commencements returned to 8,408 units in Q1 2026, following a period of volatility, with a surge in 2024 due to the expiry of energy and water connection waivers followed by very low levels throughout 2025. New home loans remain on an upward trend and increased by 15.1 per cent year-on-year in Q1 2026.
Uncommenced permissions provide a pool to draw from as viability improves
Figure 13
Annualised Units and Y-o-Y change
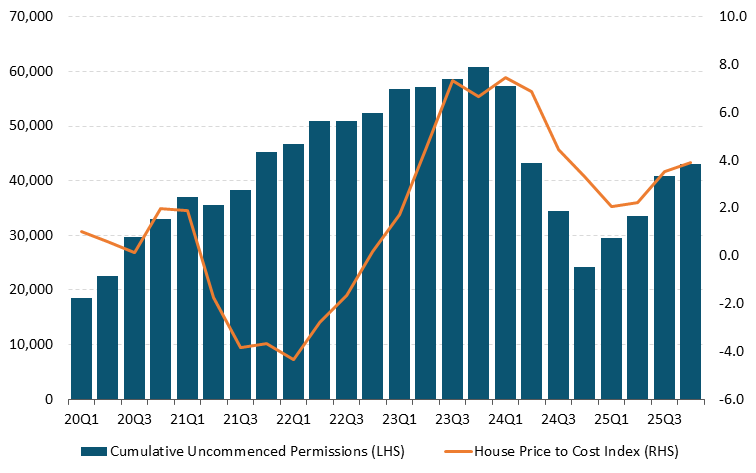
Chart data in accessible format. (XLSX 164.97KB)
The divergence in bank lending to non-financial corporations and SMEs grew further in Q4 2025. The pace of growth in net lending by banks to Non-Financial Corporations (NFCs) increased in Q4 2025 to just 1.7 per cent year-on-year, while the decline in net lending to SMEs accelerated in Q4 2025, standing at 7.7 per cent year-on-year (Figure 14). Non-bank new lending to Irish enterprises was €938 million in Q3 2025, down from €972mn in Q3 2024. SMEs received new loans from non-banks worth €744 million in Q3 2025, while new loans to larger companies was significantly lower and stood at €193 million in the same quarter.
Growth in bank lending to SMEs continued to decline while increasing to larger firms
Figure 14
Y-o-Y growth
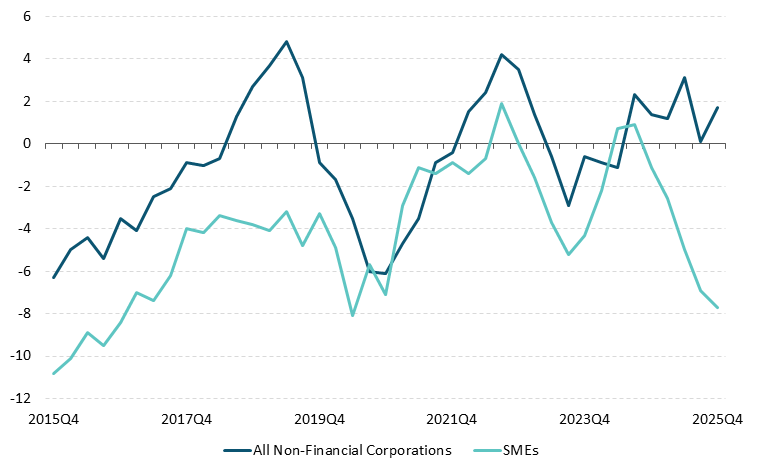
Source: Central Bank of Ireland. Chart data in accessible format. (XLSX 164.97KB)
In line with the previous Bulletin, the pace of growth in overall exports is forecast to slow from 2026 to 2028, with growth in exports of services expected to be stronger than growth in goods. Real exports of goods and services are projected to fall by 0.3 per cent in 2026 before rebounding to 6.9 per cent in 2027 and 5 per cent in 2028 (Figure 15). As discussed in the previous Bulletin, the contraction in overall exports in 2026 reflects weakness in goods exports largely resulting from strong base effects from the 2025 polypeptide export surge (Figure 16). Last year saw an exceptional contribution of goods exports to headline trade. Real exports of goods and services rose by 9.7 per cent in 2025, with real goods exports up 23.5 per cent, while real services exports were broadly unchanged. Moreover, the swing in goods exports observed from Q1 2025 to Q1 2026 also reflects a decline in export unit-values, most notably for exports to the US (Figure 17). Customs trade detail show that the value of exports of polypeptide-hormones, which had surged to exceptional levels during 2025, remained at very low levels in Q1 2026, while other pharmaceutical and chemical exports remained stable on the previous quarter. In contrast, non-pharma customs exports grew to €31 billion in the quarter – exceeding both Q1 2025 and the 2025 quarterly average. As a result, the goods exports outlook for 2026 is not driven by weak external demand but rather by base effects from a strong 2025 combined with a weak 2026 first quarter of polypeptide hormone export values. Beyond 2026, both the pharmaceutical and non-pharmaceutical sub-components of customs good exports are expected to return to stable growth (Figure 16). Global demand for polypeptide-based pharmaceuticals appears solid over the medium-term, and additional production capacity in the pharma sector is due to be operationalised by late-2026. Services are expected to be the main source of exports growth over the forecast horizon, consistent with the 2019-2024 historical average. Real services exports are forecast to increase by 5.2 per cent in 2026, followed by growth of 5.5 per cent in 2027 and 5.8 per cent in 2028. Computer services remain a key driver, accounting for about 62 per cent of services exports in 2025. The offshore goods element of Irish trade can be large (as seen in 2025) but is also volatile and difficult to anticipate. Over longer durations its net contribution may be reduced due to offsetting positive and negative fluctuations. For these reasons the forecast use a mechanical rule – a moving average of the prior six quarters is applied over the forecast horizon.
Services exports expected to contribute most to overall export growth over the forecast horizon
Figure 15: Breakdown of annual real exports forecast over 2026-2028
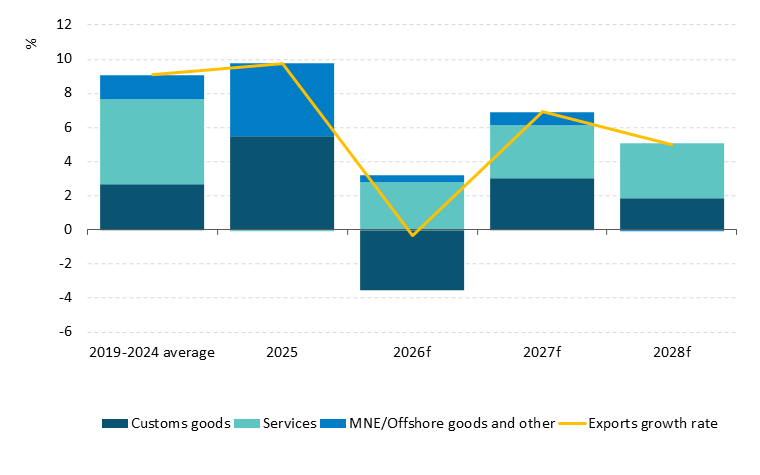
Source: CSO. Chart data in accessible format. (XLSX 164.97KB)
All sub-component of goods exports are expected to continue growing from 2026, with a continued role for polypeptides
Figure 16: Customs goods exports, split by broad category
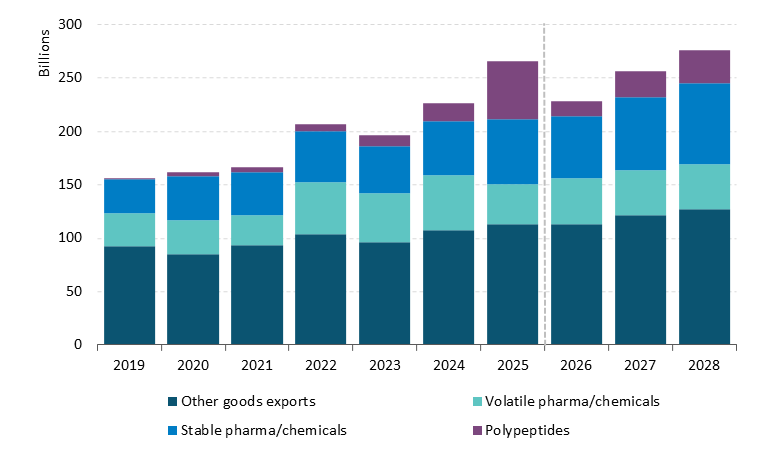
Source: CSO and Central Bank of Ireland. Chart data in accessible format. (XLSX 164.97KB)
Note: volatile pharma/chemicals mainly includes intermediate goods, whereas stable pharma/chemicals largely includes final retail/consumer goods and is observed to fluctuate less over time.
Large increase in unit values of goods exports in 2025 reversed in Q1 2026, most evident for Irish goods exports to the US
Figure 17: Value versus volume indices of IE goods exports to the US
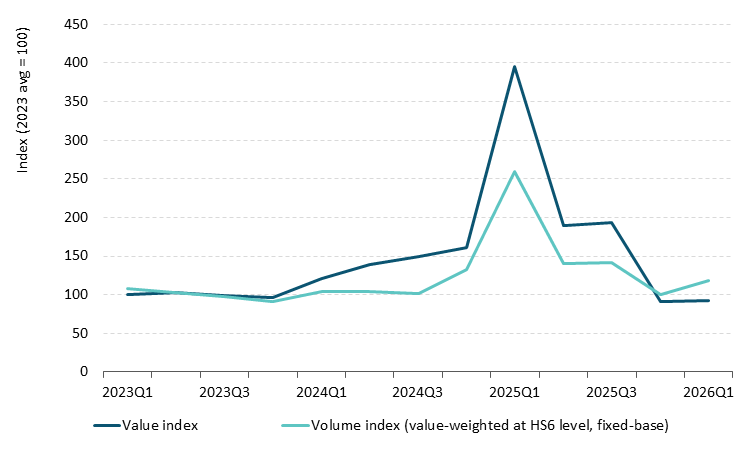
Source: CSO and Central Bank of Ireland. Chart data in accessible format. (XLSX 164.97KB)
Note: The volume index is a value share-weighted aggregate of HS-6 level goods volumes with a fixed-2023 base.
Imports are expected to continue growing strongly, supported by demand for AI-related goods and imports of royalties/licenses. Real imports of goods and services are projected to grow by 3.8 per cent in 2026, 4.6 per cent in 2027 and 4.7 per cent in 2028. This is a significant revision upwards relative to the previous Bulletin in which import growth averaged 3.4 per cent over the forecast horizon. This increase is largely driven by stronger AI and data-centre related capital goods imports, in line with the upgraded outlook for modified investment and an expected continuation of strong growth in services imports of royalties/licenses. Box A provides detail on the rapidly growing contribution of AI and data-centre related imports to Irish trade. These include both capital goods used in data centres, which therefore enter modified investment and intermediate inputs used in production, which are in turn largely exported. New chip releases, as well as large-scale data centre stock replacement, may introduce greater volatility into Irish goods imports going forward. Higher prices for imported energy are also expected to increase the value of imports in 2026. As of Q1 2026, energy-related goods represented just 5.1 per cent of customs goods imports, a share that is expected to increase over the remainder of the year, but not to reach the highs of over 10 per cent experienced in Q1 2023.
Ireland's external position is expected to remain in surplus over the forecast horizon. The modified current account (CA*), which adjusts the headline measure for distortions caused by globalisation-related flows of foreign-owned multinationals, is forecast to decrease from 7.8 per cent of GNI* in 2024 to 6.6 per cent in 2025 and to around 6.2 per cent through 2028 (Figure 18). The headline current account surplus contracted sharply from €91 billion (16.2 per cent of GDP) in 2024 to €52 billion (8.2 per cent of GDP) in 2025, despite the merchandise surplus widening from €176 billion to €230 billion. This decline was driven by primary income outflows related to foreign multinational profits, which expanded from €140 billion to €200 billion, whilst the services surplus narrowed from €60 billion to €26 billion. The headline surplus is forecast to remain at around 8 per cent of GDP, declining gradually over 2026 to 2028. A sectoral decomposition shows that the internationally dominated non-financial corporate sector accounts for most of the volatility in the headline current account, while the domestic private sector has consistently been a net lender over the last decade, contributing positively to the CA* surplus (Figure 20). As discussed in the previous Bulletin (Box B), enabling sustained higher investment could close the CA* surplus, for instance if housing output reached 55,000 units per annum and the domestic NFC investment rate approached the euro area average, the positive external balance for the domestic private-sector would be significantly reduced.
Headline and underlying external surpluses are forecast to remain sizeable
Figure 18: Headline current account/current account* as a share of GDP/GNI*
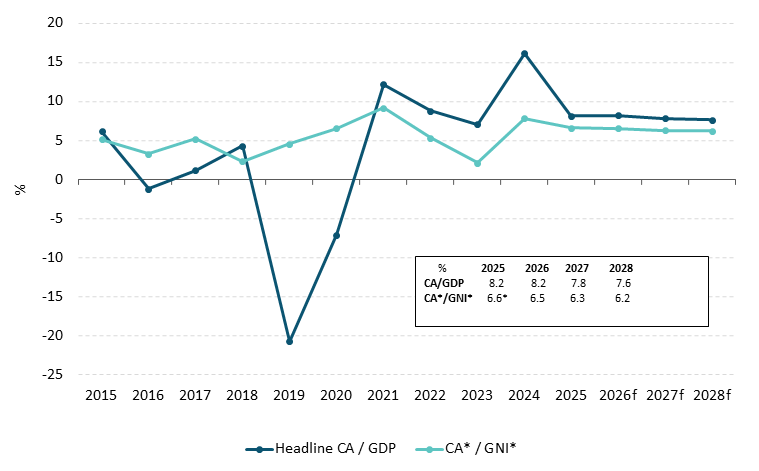
Source: CSO and Central Bank of Ireland. Chart data in accessible format. (XLSX 164.97KB)
Note: CA*/GNI* in 2025 is an estimate since these data are not released until July 2026.
Headline CA surplus dominated by activities of large multinational corporations (€bn)
Figure 19: Net lending/investment position of Irish resident sectors and headline CA
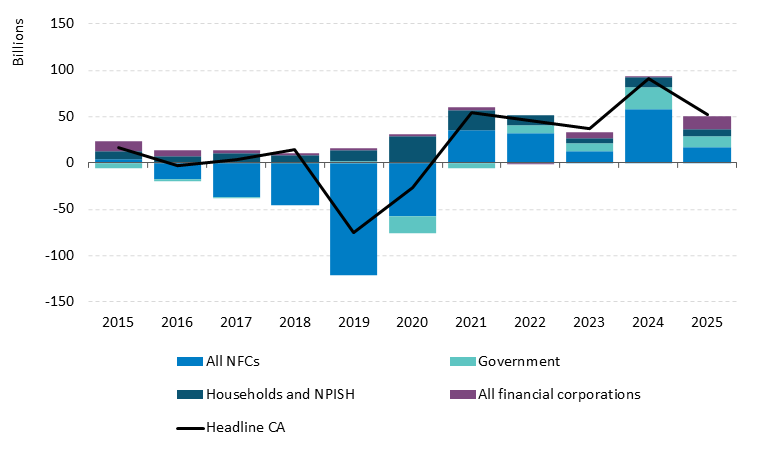
Source: CSO and Central Bank of Ireland. Chart data in accessible format. (XLSX 164.97KB)
Persistent excess saving by households and domestic businesses supports a positive CA* surplus (€bn)
Figure 20: Net lending/investment position of Irish domestic-only sectors and CA*
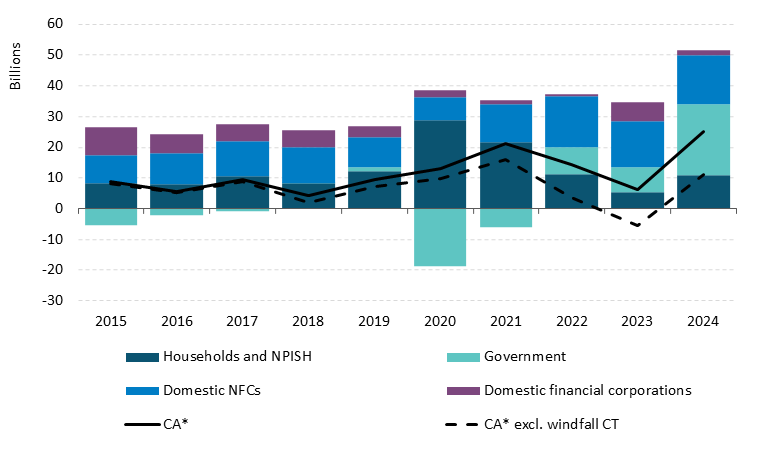
Source: CSO and Central Bank of Ireland. Chart data in accessible format. (XLSX 164.97KB)
Note: CA* data for 2025 will be released in early July.
Inflation
Headline HICP inflation forecasts have been revised upwards since the last Bulletin. HICP inflation is projected at 3.5 per cent in 2026 with forecasts of 2.9 per cent and 2.0 per cent for 2027 and 2028, respectively (Figure 8 and Table 2). The upward revisions are driven primarily by the sharp increase in energy prices in recent months (stemming almost entirely from liquid fuels, Figure 5) and the expectation that they will remain elevated for some time as reflected in higher technical energy price assumptions (Table 3 and Figure 6). These developments are broadly in line with the Adverse scenario presented in the March Bulletin’s Balance of Risks section. The energy price growth forecast for 2026 has been revised upward to 9.6 per cent, compared to the 6.4 per cent forecast in the previous Bulletin. Price increases for household gas and electricity have also recently been announced by a number of utility companies. Government fuel support measures, and the deferred carbon step and reductions in excise duty, somewhat temper the rise in energy prices and their contribution to headline inflation. Higher energy and input costs are expected to feed into food inflation which is forecast to rise to 3.8 per cent in 2027. Similar pressures feed into the prices of non-energy industrial goods components (NEIG), which in addition, have seen some recent positive momentum because of methodological revisions earlier this year (See Box D in the previous Bulletin). As a result, NEIG is estimated to make a small positive contribution to headline inflation in both 2026 and 2027. Recent month's data on services inflation are in line with expectations in the previous Bulletin, with services inflation averaging 3.4 per cent in the first quarter of 2026 (Figure 21). Measures of underlying inflation have remained below 3 per cent (Figure 22).
Table 2: Inflation Projections
| Indicator | 2025 | 2026 | 2027 | 2028 |
|---|
| HICP | 2.1 | 3.5 | 2.9 | 2.0 |
| Goods | 1.0 | 3.1 | 2.2 | 0.5 |
| Energy | -0.3 | 9.6 | 2.2 | -0.3 |
| Food | 3.7 | 2.2 | 3.8 | 2.1 |
| Non-Energy Industrial Goods | -0.4 | 1.1 | 1.0 | -0.3 |
| Services | 3.0 | 3.7 | 3.4 | 3.4 |
| HICP ex Energy | 2.3 | 2.9 | 2.9 | 2.3 |
| HICP ex Food & Energy (Core) | 2.0 | 3.0 | 2.8 | 2.3 |
Source: CSO, Central Bank of Ireland
There have been further upward revisions to technical assumptions underlying the inflation forecasts since the previous Bulletin. The most significant upward revision has been to oil prices, up 30.6 per cent per cent for 2026, compared to the last Bulletin. The Synthetic Energy commodity price index is revised up by 23.1 per cent, while wholesale electricity and gas prices were revised by 9.7 per cent and 8.4 per cent respectively. Food price assumptions from the European Commission, use-weighted, remain broadly aligned with the previous Bulletin. The euro exchange rate assumptions with respect to the USD and GBP are also mostly in line. Non-energy commodities have seen a further revision upward of approximately 4.6 per cent for 2026.
Table 3: Changes in key technical assumptions
| Indicator | QB2 2026 | QB1 2026 |
|---|
| 2025 | 2026 | 2027 | 2028 | 2025 | 2026 | 2027 | 2028 |
|---|
| Oil (USD/barrel) | 69.13 | 96.59 | 82.23 | 77.12 | 69.13 | 74.16 | 67.98 | 66.72 |
| Natural gas (EUR/MWh) | 36.25 | 45.62 | 37.51 | 27.87 | 36.25 | 42.09 | 30.53 | 23.57 |
| Wholesale electricity (EUR/MWh) | 83.63 | 89.30 | 78.19 | 68.06 | 83.63 | 81.40 | 71.55 | 64.17 |
| Non-energy commodities (USD, per cent change*) | 5.80 | 3.02 | 0.85 | -1.94 | 5.82 | -1.53 | 0.75 | -0.14 |
| EUR/USD | 1.13 | 1.17 | 1.17 | 1.17 | 1.13 | 1.17 | 1.17 | 1.17 |
| EUR/GBP | 0.86 | 0.87 | 0.87 | 0.87 | 0.86 | 0.87 | 0.87 | 0.87 |
Source: ECB, Refinitiv. Notes: *Annual per cent change. Cut-off date: May 22nd, 2026
Services inflation remaining steady during start of 2026
Figure 21: Contributions to services inflation
Year-on-year per cent change (%)
Source: CSO. Chart data in accessible format. (XLSX 164.97KB)
Marginal increase in underlying inflation measures without evident structural momentum
Figure 22: Underlying measures of inflation
Year-on-year per cent change
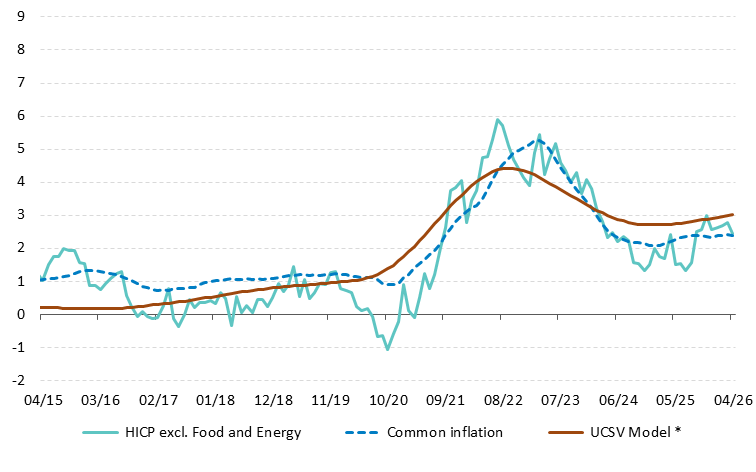
Source: Eurostat, Central Bank of Ireland calculations. Chart data in accessible format. (XLSX 164.97KB)
Note: UCSV Model stands for unobserved components model with stochastic volatility.
Labour Market and Earnings
The outlook for employment growth has weakened since the last Bulletin against a more uncertain background with divergence across indicators. With a weak outturn in Q1 reported in the Labour Force Survey, annual employment growth in 2026 is being revised down to 1.2 per cent. However, other labour market indicators point to stronger growth consistent with a normalisation rather than a persistent slowdown. Employment growth is projected to increase by 2 per cent in 2027 influenced by favourable base effects, before easing to 1.8 per cent in 2028 (Figure 23). The annual average unemployment rate is forecast to increase to 5.1 per cent in 2026 and gradually rise to 5.2 per cent in 2028. Against this background, real wage growth is expected to average 0.6 per cent over the forecast horizon though more persistent inflationary developments present downside risks.
Employment levels from the Labour Force Survey were relatively unchanged in Q1 2026 compared to a year earlier, though other labour market indicators suggest steady growth. The year-on-year change in employment in Q1 2026 was flat, while employment contracted on a seasonally adjusted quarterly basis by 0.6 per cent. Outside of the pandemic period, this year-on-year growth rate is the lowest observed since 2012. At a sectoral level, employment losses were observed in 8 of the 14 sectors, the largest of which were in the Admin (-10.7 per cent) and ICT sectors (-10.6 per cent). Employment levels in the ICT sector are likely to be adversely affected by the recent announcement of job cuts in Q2, though general demand for workers with digital skills across the economy may limit the impact on unemployment figures (See Box B for further information on the role of MNEs in the labour market).
The LFS remains the principal measure of employment in Ireland; however, as a quarterly survey, short-term movements can be influenced by factors such as sampling variability. This is particularly relevant when trends in survey-based data diverge from administrative data such as the CSO monthly employee payroll data which exhibited average year-on-year growth of 2.4 per cent in Q1. Growth rates in employee levels in the LFS and monthly payrolls have diverged since mid-2025, with payroll data pointing to stronger labour market conditions. However, there are fundamental differences between the two measures in scope and in terms of how they are measured (Figure 24). Broader indicators of labour market activity also point to stronger conditions with cumulative employment permits for the year to May up 15.3 per cent compared to 2025 and cumulative income tax receipts 7.5 per cent higher in nominal terms over the same period. Positive employment developments are expected for the remainder of the year resulting in annual growth of 1.2 per cent for 2026 as a whole, though a continued divergence between survey and administrative data presents a significant downside risk to the forecast.
Employment growth forecast to remain positive, while the unemployment rate rises marginally above 5 per cent
Figure 23: Employment and unemployment forecast profiles
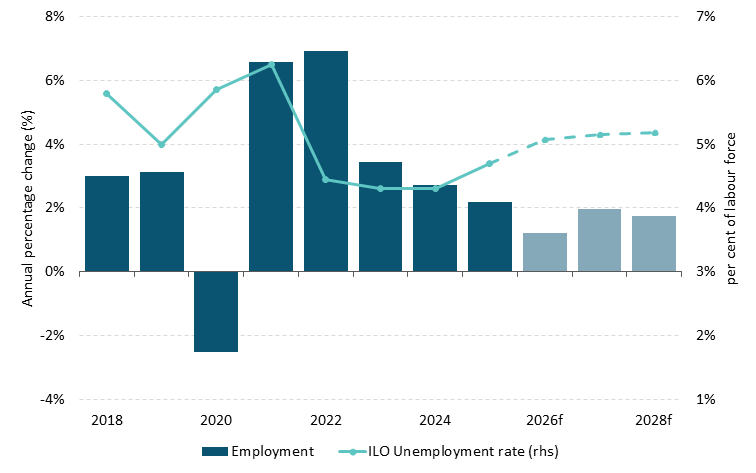
Source: CSO. Chart data in accessible format. (XLSX 164.97KB)
Measures of employee headcount have diverged of late
Figure 24: Year-on-year growth in employee levels
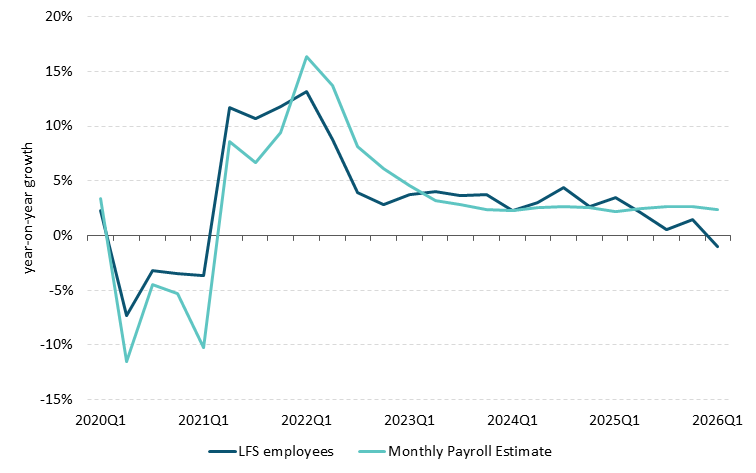
Source: CSO. Chart data in accessible format. (XLSX 164.97KB)
Note: The LFS measures the number of persons in employment and the monthly payroll records the number of employments. Levels may differ due to persons with multiple employments or the timing of when the LFS respondents are surveyed within the quarter.
The unemployment rate has increased over the past year with forecasted rates above 5 per cent for the first time since 2021. The seasonally-adjusted ILO unemployment rate in Q1 2026 measured 5 per cent, up from 4.6 per cent in Q4 2025 and the highest level since Q4 2021. This increase would have been larger if not for a decline in labour force participation amongst 15-24 year olds as those leaving employment moved out of the labour force rather than into unemployment (Figure 25). This pattern is consistent with seasonal fluctuations in youth labour market activity as participation rates typically peak in Q2 and Q3 as younger cohorts seek summer employment. These movements are expected to add to aggregate employment growth in 2026.
Various indicators show signs of a continued slowdown in labour demand. Indeed job postings are down 8.9 per cent year-on-year in May 2026 and now below the pre-pandemic level. Data from CSO EHECS indicates that the job vacancy rate has eased to 1.1 per cent in Q1 2026 though remains above its long-run average of 0.9 per cent from 2008 onwards. Taken together, labour demand (the number of available jobs) continues to grow at a faster rate than labour supply (the number of available workers) which has helped to explain the relative stability of the unemployment rate in recent years (Figure 26). Further deterioration in labour demand conditions alongside an increasing population size of younger age cohorts could see higher unemployment rates as workers face difficulties accessing employment (as outlined in Box E of QB1 2026). The unemployment rate is projected to average 5.1 per cent in 2026 and gradually increase thereafter to 5.2 per cent in 2028.
The recent rise in inactivity is driven by younger-age cohorts
Figure 25: Quarter-on-quarter change in labour market status (Q1 2026)
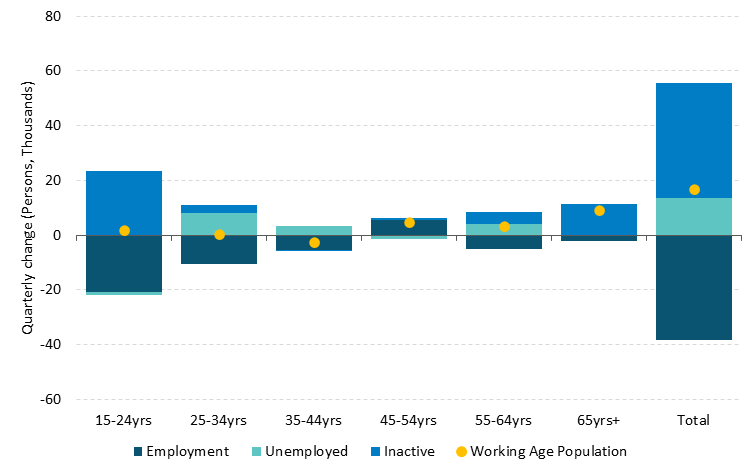
Source: CSO. Chart data in accessible format. (XLSX 164.97KB)
Labour slack is slowly increasing as labour demand moderates
Figure 26: Job postings and seasonally-adjusted monthly unemployment rate
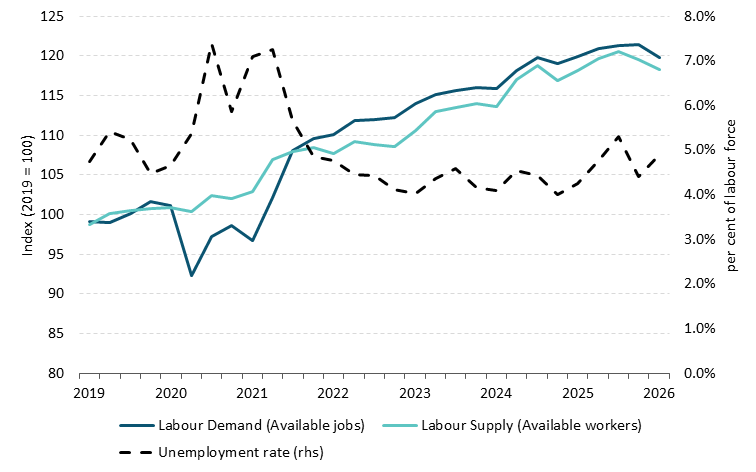
Source: CSO. Chart data in accessible format. (XLSX 164.97KB)
Note: Labour demand is the sum of the employment level and job vacancies. Labour supply is the sum of the labour force and the potential additional labour force.
Nominal wage growth forecasts may be affected by future revisions to historical data, though positive real growth is projected over the forecast horizon. Nominal compensation per employee (CPE) increased by 3.1 per cent in 2025, equivalent to 1.6 per cent in real terms. However, growth is expected to be revised upwards in the forthcoming Annual National Accounts release once additional data are included (See Figure 21 of QB1 2026). Despite this uncertainty, CPE is projected to increase in nominal terms by 4 per cent and 4.1 per cent, respectively in 2026 and 2027. Growth is then projected to slow to 3.7 per cent in 2028 as labour market conditions ease and unemployment rises modestly. Real Gross Disposable Income per household is forecast to decline by 1 per cent in real terms in 2026 due to elevated inflation and increase by an annual average of 0.7 per cent in 2027 and 2028, respectively (Figure 27). There are a number of upside and downside risks to the wage projections as the continued slowdown in job postings alongside redundancy announcements in the higher-paying ICT sector may exert downward pressure on nominal wage growth this year. At the same time, uncertainty remains regarding the next public sector pay agreement with the current deal due to expire in June 2026.
Decline in real gross disposable income in 2026 followed by pick up in 2027 and 2028
Figure 27: Year-on year growth in gross disposable income per household and underlying components (per cent)
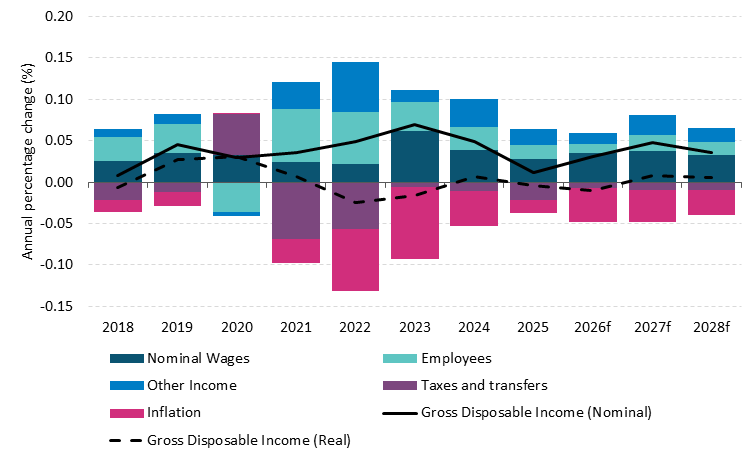
Source: CSO and author’s calculations. Chart data in accessible format. (XLSX 164.97KB)
Table 4: Labour Market Forecasts
| Indicator | 2024 | 2025 | 2026f | 2027f | 2028f |
|---|
| Employment (000s) | 2,757 | 2,818 | 2,852 | 2,908 | 2,959 |
| % change | 2.7 | 2.2 | 1.2 | 2.0 | 1.8 |
| Labour Force (000s) | 2,880 | 2,955 | 3,004 | 3,066 | 3,121 |
| % change | 2.7 | 2.6 | 1.7 | 2.1 | 1.8 |
| Participation Rate (% of Working Age Population) | 65.8 | 66.1 | 66.0 | 66.2 | 66.2 |
| Unemployment (000s) | 123 | 137 | 152 | 158 | 162 |
| Unemployment (% of Labour Force) | 4.3 | 4.7 | 5.1 | 5.2 | 5.2 |
Public Finances
The underlying budget deficit, which excludes windfall corporation tax (CT) receipts, is projected to worsen over the forecast horizon as expenditure growth is expected to exceed that of revenue growth. Annual underlying revenue is projected to grow by 5.8 per cent on average over the 2026-2028 period, while average annual spending growth is expected to rise by 7.4 per cent. As a result, the underlying budget deficit is projected to more than double from 1.5 per cent of GNI* in 2025 to 3.2 per cent in 2028 (Table 5). These projections are more favourable than at the time of the March Quarterly Bulletin, partly reflecting a stronger outturn for 2025 than had been anticipated at that time. A headline general government (GG) surplus of €11.2bn was recorded in 2025 (estimated at 3.3 per cent of GNI*), with the better outturn primarily due to expenditure being lower than what had been expected at the time of Budget 2026. Looking ahead, the headline budget balance is forecast to remain in surplus, driven by strong CT growth, which is expected to benefit from the implementation of the Minimum Tax Directive in 2026 and 2027. Nevertheless, the headline surplus is still forecast to decline over the forecast horizon to 2 per cent of GNI* in 2028 (Figure 28), reflecting the deterioration in the underlying budgetary position. A Signed Article (PDF 1.01MB) accompanying this Bulletin assesses the medium-term outlook for the public finances.
Table 5: Key Fiscal Indicators, 2025-2028
| Indicator | 2025 | 2026(f) | 2027(f) | 2028(f) |
|---|
| GG Balance (€bn) | 11.2 | 11.4 | 12.1 | 8.4 |
| GG Balance (% GNI*) | 3.3 | 3.1 | 3.1 | 2.0 |
| GG Balance (% GDP) | 1.8 | 1.7 | 1.7 | 1.1 |
| GG Debt (€bn) | 209.9 | 206.2 | 205.1 | 209.9 |
| GG Debt (% GNI*) | 61.4 | 56.0 | 52.4 | 50.2 |
| GG Debt (% GDP) | 32.9 | 31.4 | 28.8 | 27.8 |
| Estimated Windfall CT (€bn) | 16.5 | 18.7 | 20.5 | 21.8 |
| Underlying GGB (€bn) | -5.2 | -7.3 | -8.4 | -13.4 |
| Underlying GGB (% GNI*) | -1.5 | -2.0 | -2.1 | -3.2 |
Source: Central Bank of Ireland Projections
Note: Underlying GGB excludes estimates of excess CT and receipts from the Apple state aid case; (e) is for estimate; (f) is forecast
Underlying GG deficit is projected to deteriorate over the forecast horizon, particularly in 2028
Figure 28: per cent of GNI*
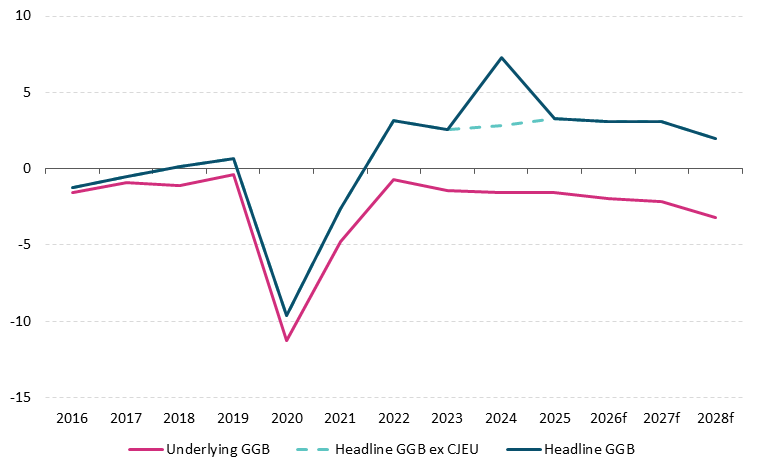
Source: CSO, Central Bank of Ireland. Chart data in accessible format. (XLSX 164.97KB)
Note: Underlying GGB excludes Central Bank estimates of excess corporation tax receipts and receipts from Apple State aid case; CJEU is Court of Justice of EU ruling on Apple state aid case.
The projected strong growth in government expenditure in the coming years is expected to be relatively broadly based. The Government’s Annual Progress Report 2026 (APR 2026), which was published in April, provided updated medium-term expenditure forecasts. This included revised forecasts for net primary spending. It is now expected to grow by 7.4 per cent this year, up from 6.6 per cent in the Medium-Term Fiscal and Structural Plan, published just four months earlier. Both current and capital spending are projected to record large increases in the coming years, with the latter expected to reach 6 per cent of GNI* in 2028, close to double its level of a decade earlier. Strong tax revenue growth occurred in the first five months of the year, with receipts up 6.1 per cent year-on-year when revenue linked to the Apple state aid case is excluded. CT receipts are projected to contribute significantly to overall revenue growth in the coming years, although there remains uncertainty over the exact impact of the Minimum Tax Directive and the effect of US trade and tax policy. Additionally, in response to the US-Iran conflict, the Government implemented fiscal supports, mostly on the revenue side, which are estimated to cost €755mn. These measures are due to expire by the end of July. The factors that pose a risk to the public finances are discussed in further detail in the Balance of Risks below.
The General Government debt (GGD)-to-GNI* ratio is projected to continue to decline over the medium term. The debt ratio is expected to fall from 61.4 per cent of GNI* in 2025 to 50.2 per cent in 2028 (Figure 29). This reflects a combination of projected headline primary surpluses (averaging 3.7 per cent of GNI* over 2026-2028) and the expectation of a continuing favourable interest rate-growth rate differential (Figure 30). The supportive impact of the latter is expected to weaken, however, against the backdrop of a tightening of financing conditions. The State’s annual interest costs are forecast to double from €3bn in 2025 to €6bn in 2030, with the effective interest rate also expected to double to around 3 per cent over the same period. The National Treasury Management Agency (NTMA) has so far this year raised €8.25bn through bonds sales, roughly 70 per cent of its funding range for the year. Ireland’s cash position remains strong, with a liquid balance (inclusive of receipts from the Apple state aid case) of €21.7bn at end-May. Part of these balances were used to redeem the €12bn treasury bond that expired in May.
Debt ratio is projected to fall to close to 50 per cent of GNI* by the end of the forecast horizon
Figure 29: per cent of GNI*, per cent of GDP*, €billion
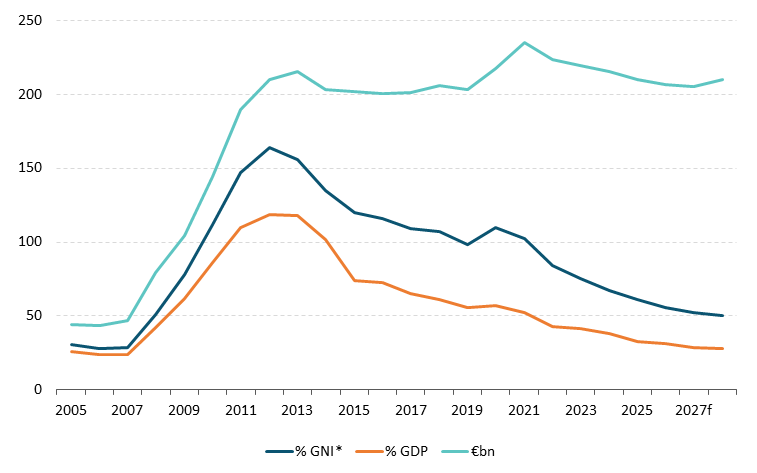
Source: CSO, Central Bank of Ireland. Chart data in accessible format. (XLSX 164.97KB)
Projected headline budget surpluses and nominal growth are supporting a continued fall in the public debt ratio out to 2028, but interest rate on debt is rising
Figure 30: per cent of GNI*
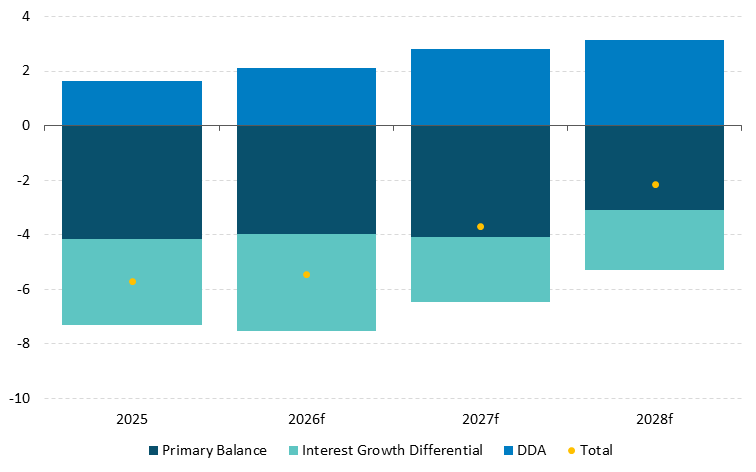
Source: Central Bank of Ireland. Chart data in accessible format. (XLSX 164.97KB)
Notes: I-G Differential is interest rate-growth rate differential; DDA is the deficit-debt adjustment
Balance of Risks to the Outlook
The balance of risks to the overall outlook for economic activity is firmly tilted to the downside, with inflation risks clearly to the upside. The central forecasts incorporate higher energy price assumptions compared to those which underpinned the previous projection in March 2026. The latter had already been revised up compared to the energy price paths from December 2025, before the outbreak of the war in the Middle East (Figure 31 and Figure 32). On 15 June 2026, the US and Iran announced a memorandum of understanding to extend their ceasefire by 60 days and reopen the Strait of Hormuz. The agreement is due to be signed on Friday 19 June. At the time of writing, there remains uncertainty as to when the current disruption to the Strait of Hormuz shipping lanes – vital for the transportation of oil and gas from the Persian Gulf – is likely to be alleviated and the extent to which trade through the Strait normalises. Depending on the course the conflict takes and the durability of the new agreement, there is a risk that energy prices could be higher than assumed in the central forecasts, while a more benign outcome is also possible. Given this uncertainty, alternative stylised scenarios are presented as in our previous Quarterly Bulletin in March 2026. In the milder scenario, oil and gas prices are around 15-20 per cent below the baseline levels throughout the horizon. This projected path may arise should the conflict be resolved swiftly, leading to a rapid normalisation of global oil and gas markets. In contrast, the adverse and severe scenarios assume higher energy price and food commodity prices, heightened uncertainty and tighter credit conditions. In the adverse scenario, global oil and gas prices rise by 10 and 14 per cent, respectively, above the baseline in 2026, with prices remaining persistently higher than the baseline out to the end of 2028. The adverse scenario also assumes that global food prices rise by 12 per cent by end 2028. In the severe scenario, the equivalent increases in oil and gas prices in 2026 are 32 and 63 per cent, respectively. In this scenario energy prices remain persistently elevated out to 2028 (Figure 31 and Figure 32) with some amelioration in the price level in 2028 which is, in part, a reflection of the profile of the baseline. The severe scenario assumes that global food prices rise by 24 per cent by end 2028. One of the main differences between the updated scenario assumptions compared to those used in our previous Quarterly Bulletin is that energy prices in the adverse scenario no longer return to the baseline in 2027 but remain higher across the whole projection period. The increase in energy prices in the severe scenario is also assumed to be more persistent.
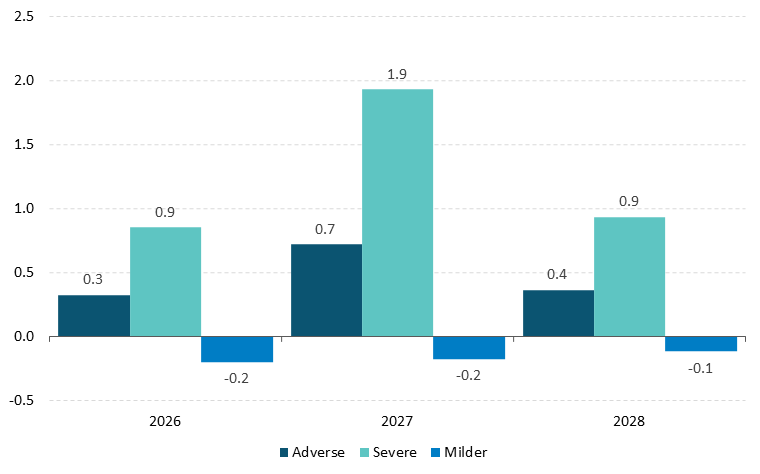
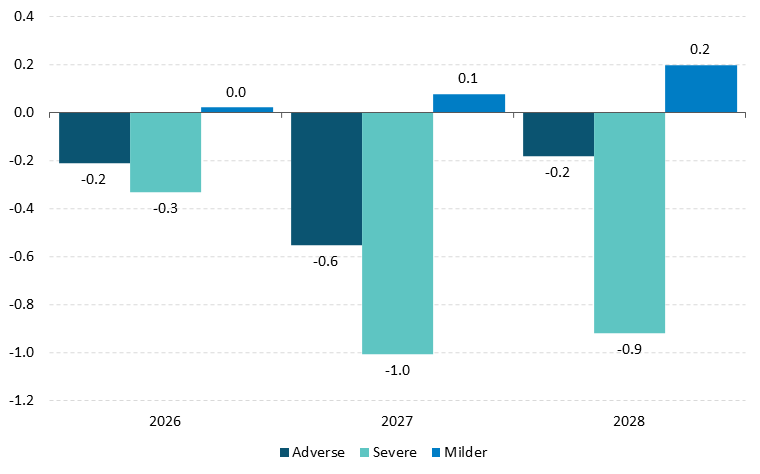
Higher energy and food commodity prices relative to baseline assumptions would increase inflation and reduce growth in Ireland relative to the central forecast. In the adverse scenario, inflation would increase by 0.3 percentage points and MDD growth would be 0.2 percentage points lower in 2026 than in the baseline (Figure 33 and Figure 34). In the severe scenario, involving more significant and persistent increases in energy and food prices, inflation would be 0.9 percentage points higher in 2026 and MDD growth would be 0.3 percentage points lower than in the baseline projections. In the updated severe scenario, an estimated further 1.9 percentage points would be added to inflation in 2027, with MDD growth 1 percentage point lower. Applying these estimated impacts from the severe scenario to the central forecasts, HICP inflation would stand at 4.4 per cent and 4.8 per cent in 2026 and 2027 respectively. MDD growth would be reduced to 3 per cent in 2026 and 1.8 per cent in 2027. Higher global commodity prices would reduce economic activity in Ireland’s main trading partners, thereby lowering external demand for the traded sector of the economy. This results in a decline in exports and activity this sector which, over time, spills over to investment and the broader domestic economy, further reducing MDD and contributing to a decline in overall output, relative to the baseline projection. In the milder scenario, international energy prices decline more swiftly reducing the pressure on inflation. This would benefit economic activity in Ireland and support stronger global growth. Inflation in Ireland would be slightly lower than in the baseline across the forecast horizon, but would still remain above the rates projected before the conflict as the impact of the large rise in energy prices already experienced takes time to recede.
Updated scenario assumptions related to the Middle East conflict
Figure 31: Oil prices (level), $ per barrel
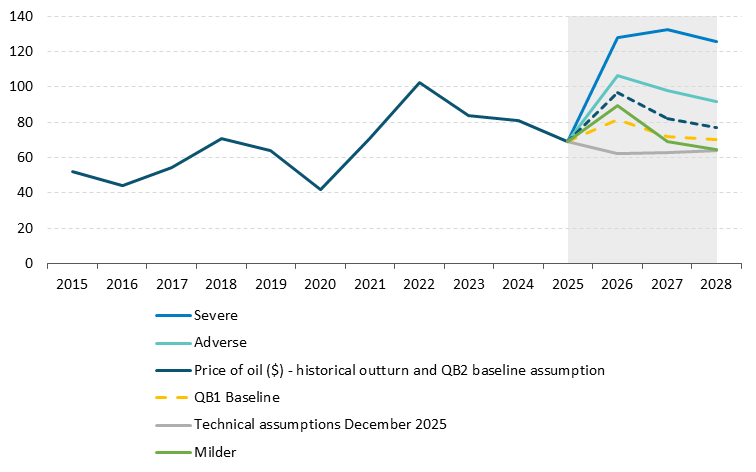
Source: ECB. Chart data in accessible format. (XLSX 164.97KB)
Figure 32: Gas prices (level), € per MWh
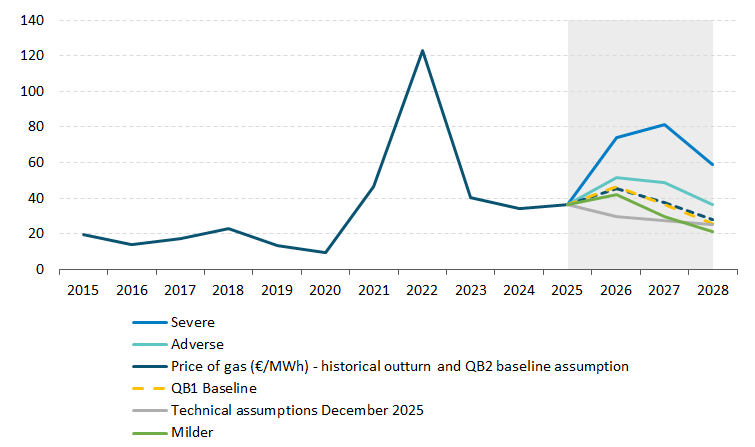
Source: ECB. Chart data in accessible format. (XLSX 164.97KB)
Swift resolution of Middle East war would benefit the economy but escalation would see higher inflation and weaker growth than in the baseline
Figure 33: Inflation, p.p. deviation from baseline
Source: Central Bank of Ireland. Chart data in accessible format. (XLSX 164.97KB)
Figure 34: MDD growth, p.p. deviation from baseline
Source: Central Bank of Ireland. Chart data in accessible format. (XLSX 164.97KB)
These scenarios are partial and likely underestimate the impact on growth and inflation of any further surges in energy prices. The scenarios provide estimates of the sensitivity of baseline inflation and growth forecasts to a change in key conditioning assumptions but there are caveats that should be considered in interpreting the results. First, a sharper increase in energy prices than those considered in the severe scenario, while unlikely, could occur if inventories fall dramatically and supply from other regions outside the Middle East does not sufficiently fill the gap to meet global demand. Even so, the scenarios consider the impact of increases in energy and food commodity prices along with higher uncertainty a tightening of financing conditions. An escalation of the conflict could trigger more complex risks to global supply chains for a broader range of commodities and these effects are not explicitly included or may not be adequately captured in the scenarios (see Box C). These indirect effects from elevated energy costs could see larger impacts on inflation and growth than reported here. If combined with more pronounced second-round effects arising from wage adjustments, these could provide further upward pressures to prices and increase the persistence of this shock on headline inflation. As is the standard convention, the scenarios assume monetary and fiscal policy are unchanged compared with the baseline.
The balance of risks to the export forecast is to the downside given the high level of concentration in pharma and ICT exports, amidst continued risk of shifts to international trade and investment policies. The baseline forecasts assume a recovery in polypeptide hormone exports over the remainder of 2026 from their low levels at the beginning of the year. A more persistent fall back in polypeptide hormone exports than projected in the baseline would materially lower headline exports and GDP, given the outsized contribution of this product category to Irish exports. On the upside, if global demand for diabetes and obesity treatments continues to rise rapidly, pharma exports could remain higher for longer than assumed in the baseline. There is considerable uncertainty around our baseline projections for the path of goods exports, particularly in light of a recent divergence between volume-based measures of exports to the US and the value assigned to these (Figure 17). Services exports could outperform if higher global investment in ICT and AI translates into stronger exports of computer and business services from Ireland and if the adoption of AI technologies yields productivity improvements. This could also result in higher domestic investment than in the baseline forecasts. Over the medium term, there are downside risks to Irish exports and corporation tax receipts if US companies actively reduce the volume and value of their activity in Ireland. Changes in US corporate tax or industrial policy could affect the location of intangible assets and production, with knock on effects for goods and services trade, investment and corporation tax receipts. Firms in the services sector differ from their counterparts in the manufacturing sector as the required sunk investments in Ireland tend to be lower. As a result, the activity and employment arising from the MNE-dominated parts of the services sector is likely to be more sensitive to negative shocks.
AI-related developments are likely to have a meaningful impact on the economy over both the short and medium term, though both the magnitude and nature of these changes are highly uncertain. As discussed in Box A, AI-related trade and investments are growing rapidly and are likely to add volatility to modified investment and goods imports. The rapid recent developments in artificial intelligence have increased private investment in several multinational ICT companies with operations in Ireland, with positive implications for the Irish economy. However, there are potential downside risks. The frontier of AI development is taking place in a small number of foreign companies. Their market valuations are dependent on exceptional future earnings, and a continued pace of improvement in the underlying technologies they are developing. Despite their huge potential, any adverse developments in their business models or disappointments in the trajectory of their products may lead to a correction in equity prices for the broader technology sector with implications for Ireland, including lower exports, investment, employment and tax revenue. However, this same exposure presents upside risk. Over the medium term, there is a lot of uncertainty around the purported productivity impact of AI, and how this will reshape the labour market. In principle, AI-related productivity increases could boost growth, both directly through adoption by Irish-based firms, and indirectly through Ireland’s substantial trade and investment links to the U.S. and the rest of the world. In terms of FDI, almost 6-7 per cent of business employment is in IDA-supported services firms, which are largely U.S. technology-related (see Ruane et al., 2025 (PDF 1.4MB)). These firms are likely to be early adopters of AI, presenting a double-sided risk. On the one hand, they may see their labour share drop as AI substitutes for an increasing number of tasks. On the other hand, this may enable them to gain global market share and increase scale. The net effect on employment is ambiguous. In addition, a new generation of U.S. technology firms are growing amidst the AI revolution. Whether Ireland can continue the role it has played historically as the European headquarters of U.S. tech multinationals will play an important role in shaping future FDI, employment and tax revenue. More broadly, Yadav and McIndoe Calder (2026) (PDF 1.8MB) show that a substantial proportion of workers in the Irish labour market are in occupations with some exposure to AI, albeit with differing degrees of complementarity. Whether the productivity gains from AI are achieved by complementing workers or substituting for them will determine the overall impact on employment and wages.
There is a risk that capacity constraints could become worse if progress on alleviating infrastructure gaps in the economy is delayed or inadequate. This risk could arise even if a slowdown in the pace of economic growth transpires. Planned expenditure under the National Development Plan is designed to address shortages of critical infrastructure in water and waste water, energy, transport and housing. Reforms such as those in the Accelerating Infrastructure Report and Action Plan are designed to reduce delays in the delivery of large national infrastructure projects. Delayed progress resulting in persistent deficits in basic infrastructure represent a downside risk to the projections for investment. If this materialised, lower investment would act as a drag on long-term growth and productivity. Over the short run, this could result in higher and more persistent inflation triggered by domestic pressures and, with competitiveness impaired, weaker economic growth occurring over the longer term. Domestic capacity constraints and inflationary pressures – and the associated negative implications for long-term growth – would be aggravated if the pattern of procyclical budgetary policy persists.
Detailed Forecast Table
| | 2024 | 2025e | 2026f | 2027f | 2028f |
|---|
Constant Prices | | | | | |
| Modified Domestic Demand | 1.8 | 4.9 | 3.3 | 2.8 | 3.3 |
| Modified Gross National Income (GNI*) | 4.8 | 4.7 | 2.4 | 3.0 | 3.5 |
| Gross Domestic Product | 2.6 | 12.3 | -2.7 | 6.5 | 4.0 |
| Final Consumer Expenditure | 3.0 | 2.9 | 1.8 | 1.9 | 2.0 |
| Public Consumption | 4.8 | 3.9 | 3.4 | 2.8 | 2.8 |
| Gross Fixed Capital Formation | -28.5 | 42.6 | 3.5 | 3.0 | 3.9 |
| Modified Gross Fixed Capital Formation | -4.2 | 10.9 | 6.7 | 5.0 | 6.7 |
| Exports of Goods and Services | 8.6 | 9.7 | -0.3 | 6.9 | 5.0 |
| Imports of Goods and Services | 2.7 | 9.5 | 3.8 | 4.6 | 4.7 |
| Total Employment | 2.7 | 2.2 | 1.2 | 2.0 | 1.8 |
| Unemployment Rate | 4.3 | 4.7 | 5.1 | 5.2 | 5.2 |
| Harmonised Index of Consumer Prices (HICP) | 1.3 | 2.1 | 3.5 | 2.9 | 2.0 |
| HICP Excluding Food and Energy (Core HICP) | 2.3 | 2.0 | 3.0 | 2.8 | 2.3 |
| Compensation per Employee | 4.3 | 3.1 | 4.0 | 4.1 | 3.7 |
| General Government Balance (% of GNI*) | 7.3 | 3.3 | 3.1 | 3.1 | 2.0 |
| ‘Underlying’ General Government Balance (% of GNI*) | -1.6 | -1.5 | -2.0 | -2.1 | -3.2 |
| General Government Gross Debt (% of GNI*) | 67.1 | 61.4 | 56.0 | 52.4 | 50.2 |
| Modified Investment (% of Nominal GNI*) | 19.2 | 20.7 | 21.0 | 21.1 | 21.9 |
Revisions from previous Quarterly Bulletin (percentage points) | | | | | |
| Modified Domestic Demand | 0.0 | 0.0 | 0.4 | 0.3 | 0.1 |
| Gross Domestic Product | 0.0 | 0.0 | -4.0 | 2.2 | -1.2 |
| HICP | 0.0 | 0.0 | 0.6 | 0.2 | 0.1 |
| Core HICP | 0.0 | 0.0 | 0.6 | 0.3 | 0.1 |
Quarterly Bulletin No. 2 2026: Boxes
Modified machinery and equipment (M&E) investment reached €15.2 billion in Ireland in 2025, the highest level on record. The adoption of artificial intelligence (AI) and the continued expansion of data centre activity in Ireland have been mentioned
as factors contributing to the recent growth in investment. Since much of this type of investment is imported, an examination of more granular import data can reveal the magnitude
of AI hardware related spending and help to disentangle its effects on measures of the domestic economy and the external balance. This Box uses detailed goods import data to quantify the import-investment link and discuss potential implications for
modified investment (GFCF), modified domestic demand (MDD) and the modified current account (CA*) in Ireland. The analysis uncovers a recent surge in AI-linked data centre hardware
imports into Ireland and shows that for these goods: i) almost half are classified as capital goods (rather than intermediate); ii) they have a short depreciation cycle relative to other types of imports, and; iii) they appear to have contributed
to the late 2025 and early 2026 pick-up in modified investment in Ireland.
The interpretation of Irish investment and output data has long been complicated by the activities of foreign-owned multinationals (Ruane et al., 2025;
FitzGerald, 2018), which is why modified GFCF and MDD have become standard reference series for domestic activity. Even so, the modified aggregates have shown
unusually large recent movements, particularly in machinery and equipment. Three structural features of the Irish economy help explain why an AI-led investment cycle of the kind documented
for the United States in Waugh (2026) could explain
developments here. First, Ireland hosts a disproportionate share of Europe’s hyperscale data centre (DC) activity, with data centres on track to account for around one third of total electricity demand by the early 2030s. Second, the largest global cloud and AI infrastructure providers maintain substantial Irish-resident operations through which compute hardware for European customers is procured and capitalised, so that hardware imported by these resident entities
can enter modified investment even where the ultimate user is located outside Ireland. Third, Ireland hosts several large-scale semiconductor manufacturers engaged in substantial
cross-border trade.
An AI and data centre-related import basket
We construct a data centre related goods imports basket from Eurostat Comext data, following the AI-theme taxonomy in Waugh (2026). Similarly, we split AI-related Irish goods import data into four baskets (A to D), ordered by how directly each group of imports relates to data centre hardware. These range from the narrow AI core (Basket A: microchips, processors, memory, servers,
core switching) out to broader site infrastructure (Basket D).
This combined AI-related import basket increased by 176 per cent between its average quarterly value in 2023 and its peak in 2025-Q4, reaching close to €18 billion and accounting for 13 per cent of total imports. (Figure 1). Other goods imports are
roughly flat over the same period, demonstrating that the strength in headline imports in 2025 reflected demand for a narrow set of concentrated products.
The contemporaneous import flow is the trade counterpart of a rapid expansion in the underlying data centre stock, as proxied by their electricity demand (Figure 2). Data centres are projected to account for around a third of total Irish electricity demand
by the early 2030s, up from 23 per cent in 2024.,
AI-related goods imports and the Irish data-centre pipeline
Figure 1: AI basket versus other imports (index)
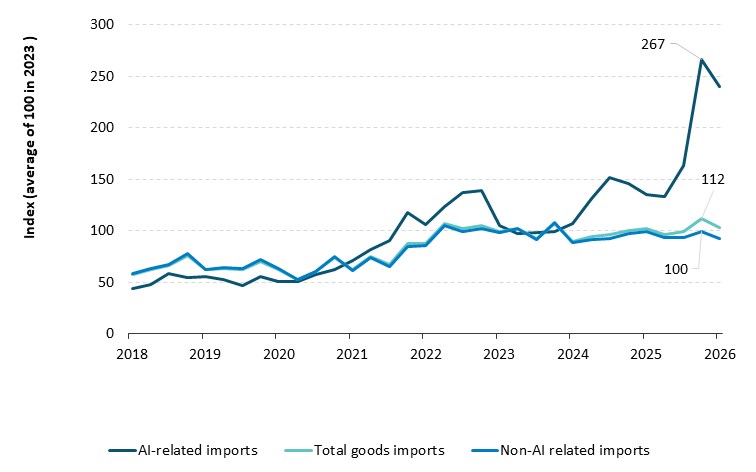
Figure 2: Irish data-centre electricity demand
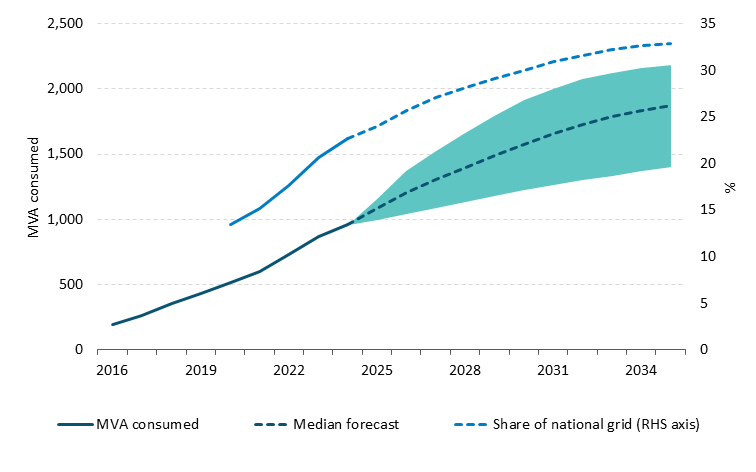
Source: Eurostat Comext, EirGrid AIRAA 2026–2035 and Central Bank of Ireland calculations. Note: LHS chart indexed to 100 in 2023 (average across quarters). Note: MVA standard for MegaVolt-Ampere and measures electrical power. The electricity consumption
of data centres was 23% of the total economy-wide consumption in 2024 and is forecast to increase to 33%.
Chart data in accessible format.
Auditing the DC-related imports basket
We next characterise the economic content of AI-related imports using PLAID, a new product-level descriptive trade dataset. Figure 3 decomposes AI imports into baskets A-D through time, with Basket A (core computing power) the lion’s share. Figure
4 and Figure 5 report two PLAID characteristics, by rate of depreciation and use of the goods.
AI hardware depreciates far faster than typical imports. The basket’s value-weighted mean ‘half-life’ – the time over which half a good’s value depreciates – is around 1.9 years, against 9 years for all Irish goods
imports (Figure 4). That implies and annual replacement rate near 36 per cent, roughly five times the wider import bundle. The shorter horizon reflects the rapid pace of obsolescence specific to AI hardware since each generation of accelerator delivers
a step-change in performance. As set out in Rice (2026), a high replacement rate combined with lumpy procurement timing (driven by chip-release cycles) can make import and investment outturns considerably more volatile from quarter to quarter than
the gradual underlying expansion of data-centre capacity would suggest.
Looking at the end use of these goods, the cumulative A-D basket is 47 per cent capital and 53 per cent intermediate, against 28 per cent capital, 36 per cent intermediate and 36 per cent consumption for total Irish imports (Figure 5). The capital-classified subset is the most readily available proxy for the imported share of modified M&E equipment.
Composition of the AI-related basket and PLAID audit
Figure 3: DC-related imports, by basket
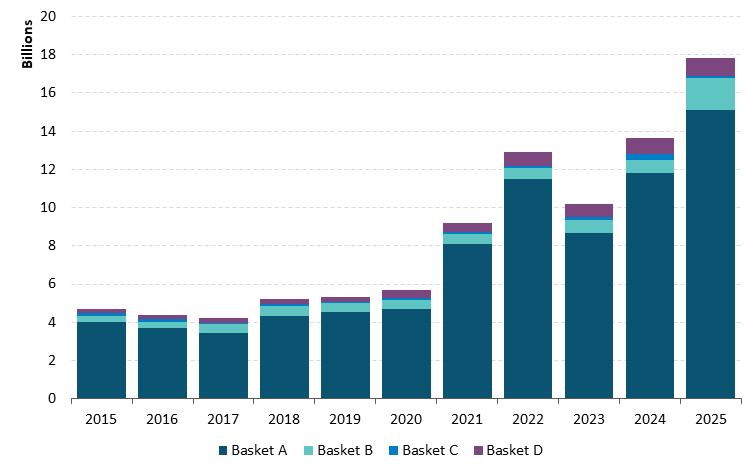
Figure 4: Mean half-life of AI imports
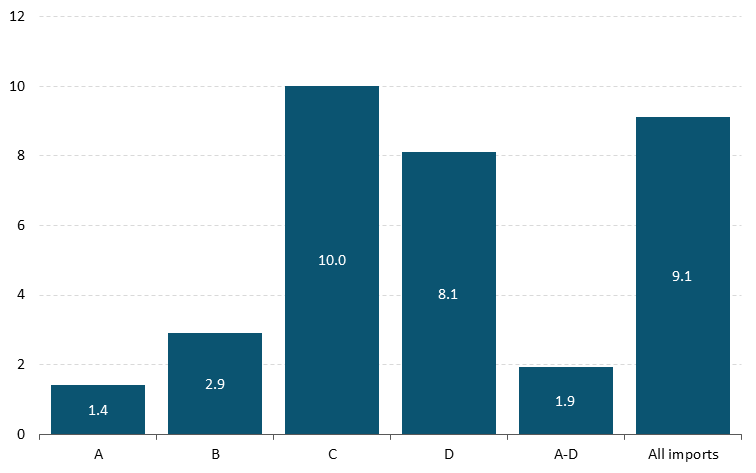
Figure 5: BEC category of AI imports
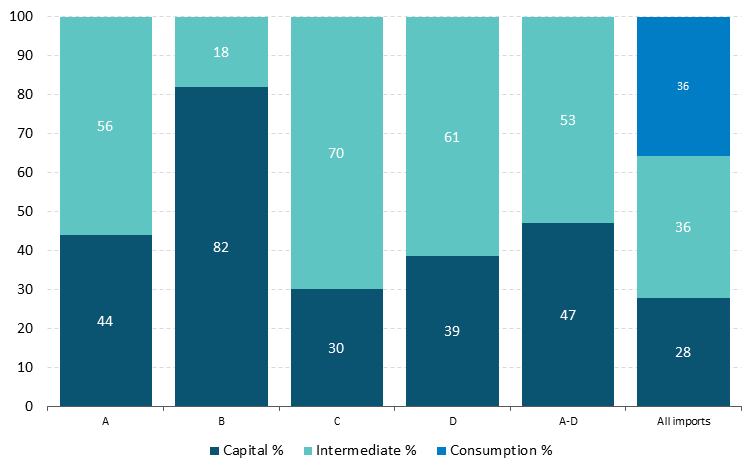
Source: Eurostat Comext, Kiel Institute PLAID, Waugh (2026) and Central Bank of Ireland calculations.
Notes: Figure 3 reports the cumulative A-D
basket in calendar-year €bn. Figure 4 reports the mean half-life of AI imports. Figure 5 BEC classification of AI imports. Figure 4 and 5 categories are Basket A, Basket B, Basket C, Basket D, A-D combined, and all Irish goods imports.
Chart data in accessible format.
Geography and a goods-trade caveat
Trade data by destination show a marked compositional shift in partner countries over time (Figure 6), in particular, imports from Taiwan are behind the significant increase in Q4 2025 and Q1 2026.
One feature of the data is matched two-way trade in certain semiconductor products. Since 2023-Q1, Irish imports of semiconductor devices and electronic integrated circuits (classified as intermediate goods in PLAID) and Irish exports of the same HS6
categories between some countries have moved closely together in level and timing. At this level of product detail we cannot establish whether these goods pass through Ireland largely unchanged or undergo a processing or production step here,
but the close co-movement is consistent with Ireland operating as a node in the semiconductor global value chain, in which a high share of the value of exports is itself imported. Either way, this portion of AI imports is unlikely to translate one-for-one
into Irish fixed capital formation. These value-chain flows matter directly for the modified current account (CA*) over the forecast horizon. Where imports are embedded in goods exports or capitalised by Irish-resident entities to deliver computer-services
exports to non-resident customers, they are offset by exports; where they are used domestically, held in stocks, or capitalised without a near-term export flow, these imports are reflected elsewhere in Ireland’s GDP. Disentangling these channels
matters for the assessment of Ireland’s external balance, where AI-related current-account swings may become more visible.
Large increase in semiconductor imports from Taiwan in recent quarters
Figure 6: AI-related imports, by country
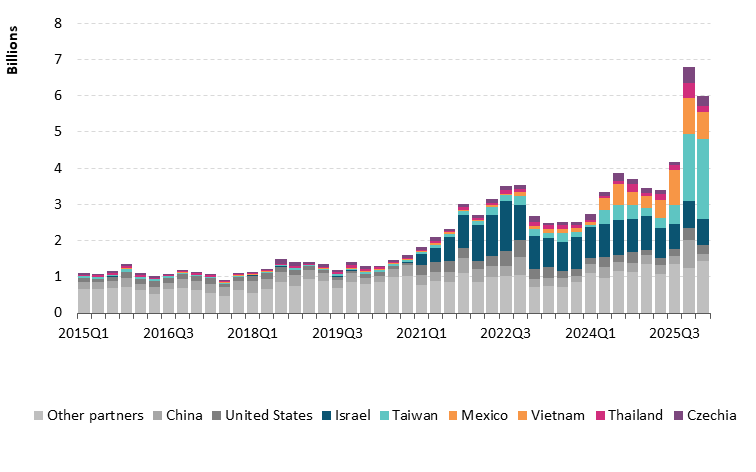
Chart data in accessible format.
From import flows to modified investment
With the pass-through caveat in mind, a more relevant comparison for the investment outlook may be between the capital-classified subset of the basket and modified M&E excluding aircraft leasing (Figure 7). The capital subset of the AI imports basket was broadly flat at €1.4–3.2 billion per year between 2010 and 2021 before increasing to around €8.1 billion in 2025. In magnitude, AI-related capital goods imports amounted to about 30 per
cent of modified M&E in 2019 and over 50 per cent in 2025. While these numbers suggest potential for higher future outturns of modified GFCF to reflect AI-related investment, it remains difficult to quantify the extent – it is likely that
a moderate share of these capital goods is also embedded in subsequent exports rather than retained as domestic capital.
Including PLAID-based intermediate goods imports (yellow portion in Figure 7), total AI-related imports sit around €2.6 billion above modified machinery and equipment investment in 2025. Some of these imports reflect intermediate inputs to value-chains
as part of two-way trade rather than fixed domestic investment. A related point concerns interpretation of the modified domestic demand aggregate. To the extent that imported AI
hardware is reflected in Irish investment and therefore forms part of modified measures of investment and domestic demand, these modified series may exhibit higher levels of volatility in future, making it more difficult to judge the underlying scale
of domestic activity in the Irish economy.
Figure 7: AI-related capital-goods imports and modified M&E investment
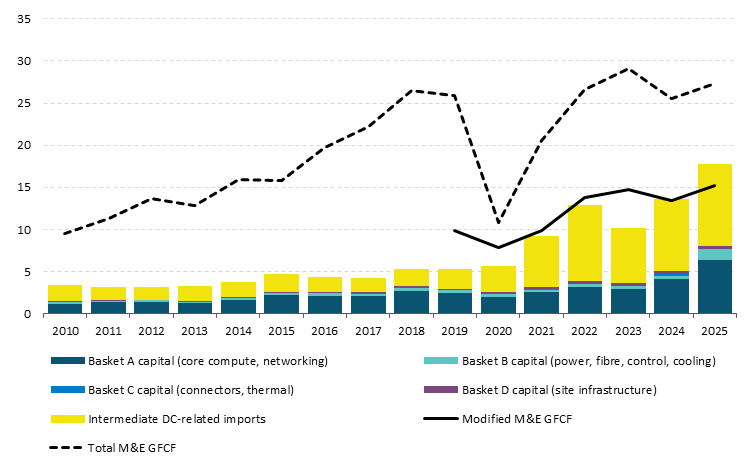
Source: CSO, Eurostat Comext, Kiel Institute PLAID and Central Bank of Ireland calculations.
Chart data in accessible format.
Multinational enterprises (MNEs) have a large presence in the Irish economy, with sectors such as pharmaceuticals and ICT playing a major role in driving exports and tax revenue which creates a number of concentration risks that are amplified by the dominance
of US MNEs in these sectors. Conefrey et al (2023) document the role of ICT as a driver of employment growth, supported by a young, internationally diverse and well-remunerated workforce, although the sector’s heavy reliance on MNEs raises questions about employment resilience were adverse global
conditions to arise. Fitzgerald (2025) outlined the large contribution of the pharma sector to Ireland’s economic output and fiscal position, reflecting its export-oriented
production model. This Box examines the role of both MNE sectors in the Irish labour market to understand how structural differences may shape employment outcomes in response to external shocks and why shocks to these sectors may have different
aggregate impacts than shocks to domestically-orientated sectors.
Pharma employment has expanded from 19,000 persons in 1998 to 73,600 in 2025, now accounting for 2.6 per cent of total employment. Despite this small share, the sector plays a disproportionately large role in Irish economic output which has been facilitated
by long-established MNE firms over several decades and a recent shift toward high-value biologics production (e.g. polypeptide hormones for diabetes and obesity treatments). Employment
in both sectors has increased notably in the last decade though ICT employment growth has moderated in recent quarters due to cyclical correction compounded by weaker demand for digital services and global restructuring due to increased AI adoption
(Figure 1). In contrast, pharma employment has continued to grow, reflecting the sector's alignment to longer-term investment cycles. Between 2015 and 2025, Ireland accounted for 14.7 per cent of pharma employment growth in the euro area, substantially
above the 4.4 per cent share of overall employment growth, underscoring the sector's strategic importance to the European pharma industry.
Both Pharma and ICT employment has increased substantially in recent years though ICT growth has begun to slow
Figure 1: Index of employment levels by sector in Ireland (2015-2025)
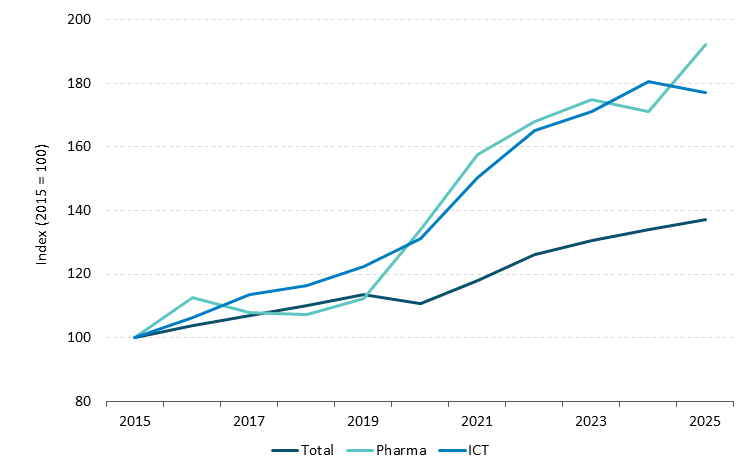
Source: CSO; LFS
Chart data in accessible format.
Education and Nationality Profile
The education profile of both MNE sectors differs markedly from the broader economy with a higher concentration of workers with third-level qualifications (Figure 2). The educational composition of total employment has risen over time as the share of
workers with tertiary-level qualifications increased from 46 per cent in 2015 to 55 per cent in 2025, which has been partly driven by these MNE sectors. Pharma accounted for 4.6 per cent of aggregate employment growth between 2015 and 2025, rising
to 5.9 per cent of employment for those with a Master’s degree (NFQ level 9) or above. ICT accounted for 10.3 per cent of overall growth over the same period, rising to 18 per cent for those with advanced degrees. Collectively, these two sectors
have accounted for close to a quarter of total employment growth of advanced degree holders in the previous decade.
The MNE sectors differ with respect to international recruitment as the nationality profile of the pharma sector aligns closely with the aggregate economy: 22 per cent of workers are non-Irish citizens (compared to 20 per cent economy-wide and 35 per
cent in ICT). Within this group, Rest of World nationals (those from outside Ireland, UK and Europe) account for 9 per cent of total employment in both pharma and the aggregate economy, but this is notably lower than the 18.4 per cent share in ICT
(Figure 3). Employment permits data reinforce these developments as pharma accounts for only 2 per cent of total permits issued between 2020 and 2025 compared to 22 per cent for ICT. This shows ICT relies more heavily on recruitment from beyond the
EU.
Educational attainment of workers has increased over time with MNE sectors exhibiting larger shares of those with Master’s qualifications and above
Figure 2: Educational attainment of employment by sector
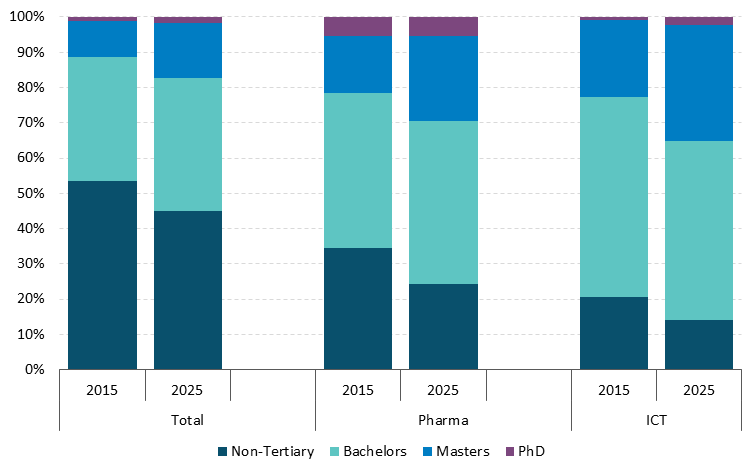
Source: CSO; LFS
Chart data in accessible format.
ICT employment growth has been more reliant on inward migration than Pharma
Figure 3: Nationality of employment by sector
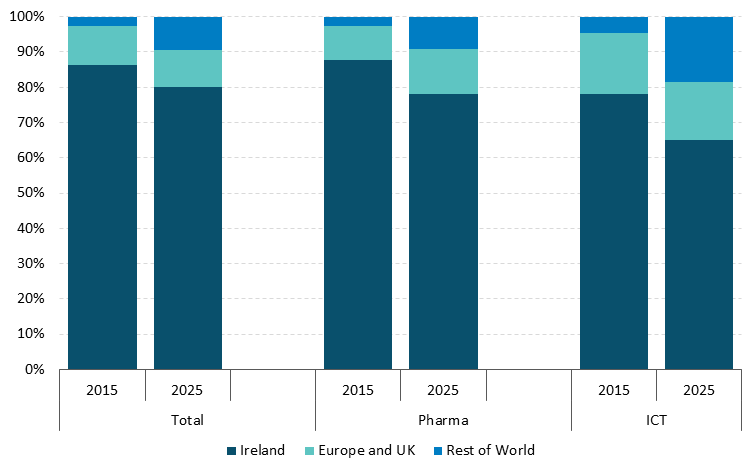
Source: CSO; LFS
Chart data in accessible format.
Employment Stability and Earnings
Workers in both MNE sectors exhibit a strong attachment to employment with average quarterly transition rates to unemployment or inactivity measuring below the economy-wide average of 4.5 per cent over the entire LFS coverage period (2.1 per cent in pharma
and 3.1 per cent in ICT). This likely reflects elevated firm demand for specialised skills and payment of above-average earnings to retain highly-productive workers. ICT workers exhibit
a greater job-to-job transition rate (3.3 per cent) compared to the total economy (2.7 per cent) which could indicate a higher transferability of skills between firms though results may be partly influenced by increased hiring activity in the sector
from 2020 onwards. Comparatively, pharma exhibits a lower job-switching rate (2.5 per cent) which may suggest employment is more closely tied to specialised production processes and
firm-specific human capital that can limit job-switching opportunities.
Average annual earnings for workers in the pharma sector were €89,576 in 2025 according to CSO EHECS data, placing the sector slightly below ICT (€89,910) and substantially higher than the economy-wide average of €52,607. The relative earnings
premium indicates that average economy-wide wages are only 60 per cent of those in the pharma sector, while the premium of pharma pay relative to ICT wages has slowly converged towards parity (Figure 4). Given that average wages in MNE-dominated sectors are considerably higher than economy averages, it is instructive to benchmark Irish pharma wages relative to other economies with large pharma export activity. Using a combination of Eurostat and CSO
EHECS data, Ireland’s average wage level of €81,700 was the highest in the euro area for 2023, placing it above Belgium (€74,500) (Figure 5). This premium may reflect both the productivity-intensive nature of work and the premium commanded
by a highly skilled workforce.
Average wages in Pharma far exceed economy average
Figure 4: Indexation of sectoral wages relative to average pharma wages
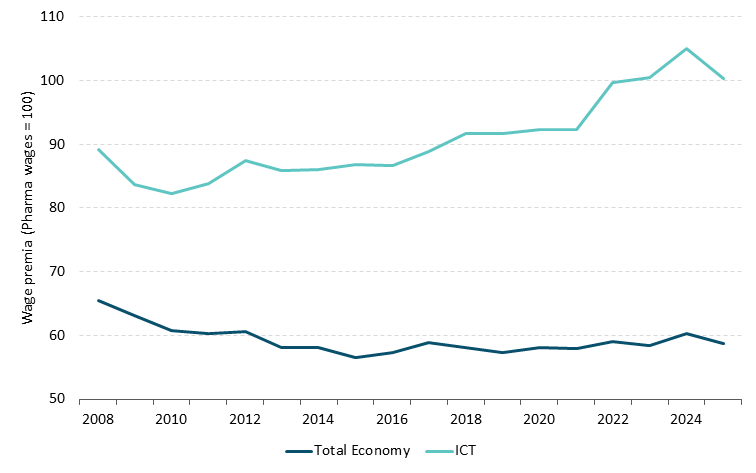
Source: CSO; EHECS
Chart data in accessible format.
Estimated wage levels for pharma workers in Ireland are the highest in Europe
Figure 5: Average wage levels in pharma sector (2023)
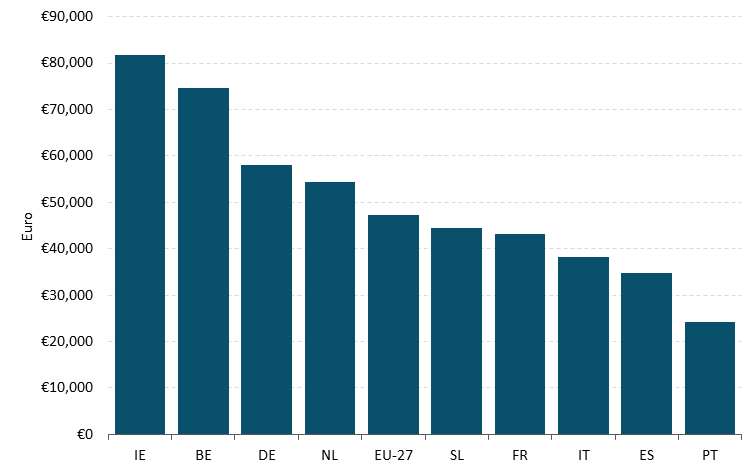
Source: Eurostat and CSO
Note: Eurostat structural business statistics (SBS) data on average total labour costs (inclusive of wages and non-wage costs such as employer contributions) for the pharma sector in Ireland are redacted due to confidentiality. Irish wage figures shown are taken from CSO EHECS data for 2023. Wage levels for other countries are estimated by applying the average non-wage cost share for workers the manufacturing sector from the Eurostat Labour Cost Index to SBS total labour costs. This estimate is performed to compare across sector-specific and country-specific employment cost structures.
Chart data in accessible format.
Future Skills Demand
Looking ahead to how domestic labour supply can meet sectoral demand, recent government reports estimate that both sectors will face recruitment challenges. ICT employment levels reached 180,000 persons in 2025, with a report on future skills requirements estimating an additional 90,000 jobs could be created by 2030 using a baseline projection. Third-level institutions will only meet half of this projected demand despite the current ICT graduate supply rising to 8,000 each year. Forecasted labour demand
for the pharma sector estimates that employment could increase by further 28,000 jobs between 2024 and 2027 under a medium-growth scenario (EGFSN, 2024).
This would result in a cumulative shortfall of 15,000 workers if relying solely on the projected domestic supply of 3,000 graduates per annum. For employment to increase to these projected levels, MNE sectors may see a greater reliance on net inward
migration in addition to attracting suitable workers from other sectors depending on the level of skills mismatch at the occupational level.
Risk assessment: Resilience and Vulnerability
Pharma and ICT represent complementary pillars of Ireland’s MNE-dominated economy. Both sectors have a higher share of workers with advanced degrees than the economy as a whole and this is reflected in higher average earnings relative to the wider
economy. In terms of employment risks, there are notable differences in their resilience profiles which reflect fundamental distinctions in production models, capital intensity, and operational flexibility. Pharma production is highly capital-intensive,
relying on large-scale manufacturing plants, complex supply chains, and a long-cycle investment model. These sunk costs and regulatory constraints limit short-run employment adjustments or operational shifts across jurisdictions and suggests that
employment is more embedded in the domestic economy relative to ICT. Additionally, pharma demand is aligned to healthcare demand, which is structurally underpinned by demographic trends such as ageing populations, making it relatively less sensitive
to cyclical fluctuations in business investment or consumer spending. However, the concentration of US-owned MNEs creates sector-specific risks as sales are prone to geoeconomic fragmentation, changing tax policy and tariff-related disruptions which
could affect long-term restructuring (Ruane et al., 2025).
ICT firms can scale operations up or down and relocate functions internationally with comparatively fewer constraints, with recent global restructuring announcements illustrating these vulnerabilities. This dynamism has contributed to strong employment
growth in Ireland, but one that is more exposed to global shocks and firm-specific restructuring decisions.
A broader risk from MNE employment loss due to a sector-specific shock is the negative effect on average wages throughout the economy. Workers displaced from high-productivity firms not only experience direct job loss but could also face limited and lower-paying
options in comparatively less-productive domestic firms. Reduced mobility options for workers in intermediate firms reduces potential wage gains, while aggregate revenue losses from income tax would outweigh profits experienced by domestic firms from
reduced labour competition (Balsvik et al, 2003). Displacement linked to increased AI adoption could place higher-earning occupations at greater risk of disruption,
such as those in MNE firms that are well-capitalised to invest in these technologies. Research suggests the modest wage gains for those remaining in employment in Ireland due to increased productivity though would not be sufficient to counterbalance
the average fall in income due to displacement (Doorley et al, 2026). However, there is considerable uncertainty at present over how this major technological change will ultimately
shape the economy and labour market and there are upside risks, given some firms at the forefront of AI development globally have a presence in Ireland. From a policy perspective, priorities should include continuous reskilling and upskilling as labour
demand shifts towards advanced digital and analytical skills. This would enhance labour mobility and help workers adapt to the changes underway (McIndoe-Calder and Yadav, 2026).
The outbreak of war in the Middle East triggered a major shock to the global economy. The immediate and most significant economic impact has arisen from the effective closure of the Strait of Hormuz and damage to regional infrastructure. Beyond the effects on energy markets, the war is also reshaping supply chains for non-energy and critical inputs with differential impacts across economies. This Box provides an overview
of the direct impact of the war on global commodity markets for energy and non-energy products, identifying the main channels through which the shock is being transmitted to both the global economy and Ireland. The Box finds that the war has resulted
in significant disruption to the price of key commodity inputs widely used in global manufacturing. Outside of energy goods, the direct exposure of the Irish economy to imports from the Middle East is low but the negative spillovers from the effects
of the war on the global economy are still unfolding and are likely to cause slower growth and higher prices in Ireland, the extent of which will depend on the duration and severity of the conflict.
The Strait of Hormuz and the Physical Disruption
The outbreak of war in the Middle East has lead to physical infrastructure being damaged and shipping through the Strait of Hormuz has ceased. In March 2026, global oil supply fell by
an estimated 10 million barrels per day (mb/d) – the largest single-month disruption on record. The conflict has also caused significant physical damage to ports, pipelines, and processing facilities across the Gulf region impacting both the
short- and medium-term capacity of the region. It is estimated that the conflict has caused the loss of 15 per cent of cumulative incremental global LNG supply for the period 2026-2030 (IEA, 2026).
The Strait of Hormuz is one of the world’s most important global shipping routes. Before the conflict, vessels transiting the strait accounted for approximately 34 per cent of global seaborne crude oil trade, 29 per cent of liquefied petroleum gas
(LPG) trade and it was a strategically important route for other products such as LNG, refined petroleum product trade and chemicals and fertilisers (see Figure 1). Daily vessel transits through the strait have collapsed from approximately 100 per
day in the year prior to the conflict to fewer than 10 per day in recent weeks (see Figure 2). The closure has not been confined to oil tankers: container ships, dry bulk carriers and general cargo vessels have all ceased transit. This breadth reflects
the strait's full role in global trade — it is not simply an energy corridor, but a gateway for manufactured goods, grains, chemicals, and a wide range of other commodities.
Strait of Hormuz is a key transit route for important global commodities
Figure 1: Per cent of global seaborne trade volume
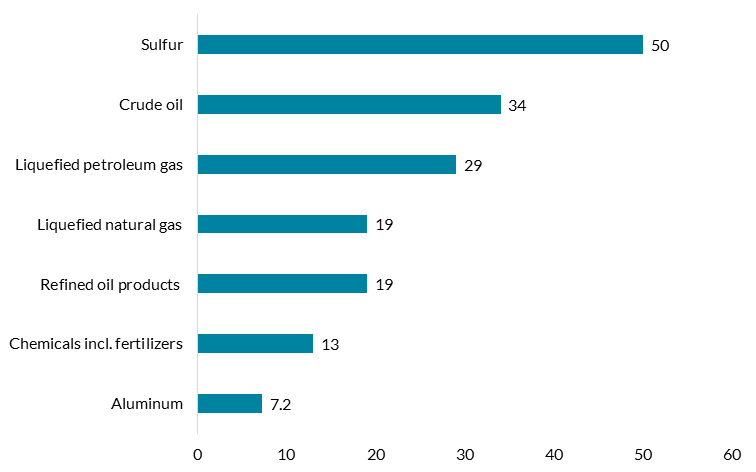
Source: World Bank (2026).
Chart data in accessible format.
Trade through the Strait of Hormuz has stalled
Figure 2: Number of vessel transits in 2026
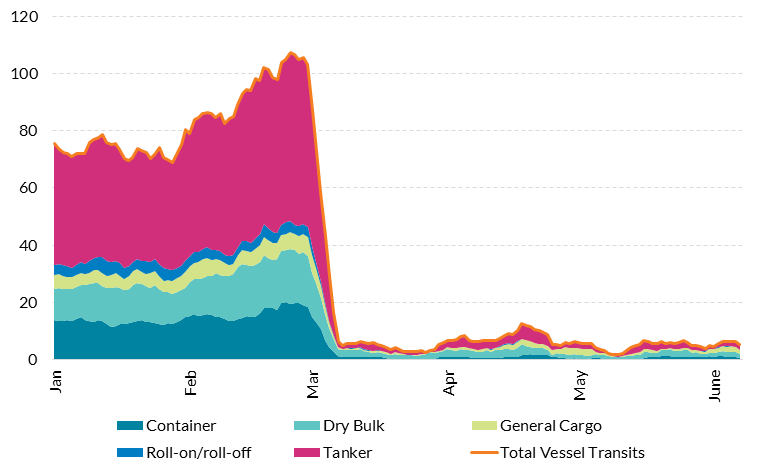
Source: IMF Portwatch.
Chart data in accessible format.
What Commodities are Affected?
Oil and gas are two of the main commodities affected by the conflict in the Middle East. The region accounts for approximately one-third of global oil output and one-quarter of global liquefied natural gas (LNG) supply. In Q2 2026, global oil production
fell from 108 to 95 million barrels per day and since the conflict began, the price of Brent crude has increased from an average of $69/bbl in February to an average of $104/bbl in May. The price of gas has increased from an average of €32/MWh
in February to an average of €47/MWh in May (Table 1).
Table 1: Monthly commodity price changes since the start of the conflict
| Commodity | Average price in February | Average price in May | Price change | Price change (%) |
|---|
| Brent oil ($/Bbl) | 69.4 | 103.7 | 34.3 | 49.5 |
| European gas TTF (€/MWh) | 32.4 | 47.0 | 14.6 | 45.0 |
| Jet fuel ($/Gal) | 2.3 | 4.0 | 1.8 | 79.1 |
| Fertiliser ($/Mt) | 497.1 | 661.7 | 164.5 | 33.1 |
| Aluminium ($/Mt) | 3065.2 | 3658.2 | 593.0 | 19.3 |
Source: Refinitiv, authors’ calculations.
The Gulf also contributes a significant proportion of global supply of non-energy products. The price of fertiliser (urea) has increased by 33 per cent since February reaching levels not seen since the Russia-Ukraine energy shock. The strait is also a
critical trade route for sulphur, which is used to produce fertiliser, which has a knock-on impact on food production costs. The Kiel Institute has identified rare gases such as helium and hydrocarbon derivatives for which the Middle East is an important
global supplier. The strait accounts for 75 per cent of global hydrocarbon derivative exports and 33 per cent of global helium production. These products are used by the semiconductor and pharmaceutical sectors. The Gulf is a significant producer
of base metals such as aluminium, and prices for these metals are currently at all-time highs (Table 1). Whilst the Irish economy imports relatively small quantities of base metals directly, they are used as inputs in many other goods.
Disruptions extend beyond energy prices to the broader functioning of global supply chains. Global shipping costs have risen modestly (from between 7 and 30 per cent) in response to the conflict while jet fuel prices have increased by approximately 80
per cent, creating cost challenges for the aviation and distribution sectors (Figure 3). The Global Supply Chain Pressure Index (GSCPI), which aggregates multiple indicators of global logistics and production disruption, spiked well above its historical
mean in April 2026, although it is still below the peak recorded during the 2022 Russia-Ukraine energy shock (Figure 4).
Global shipping costs have risen and supply chain disruption has increased
Figure 3: Shipping cost indices and jet fuel price, January 2020 = 100
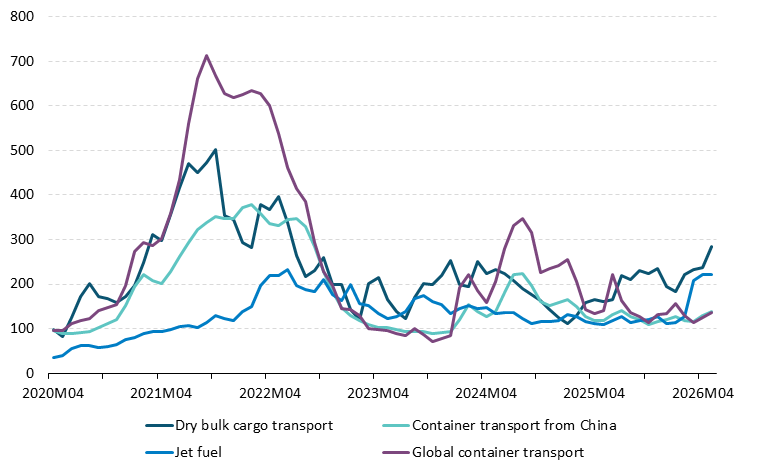
Source: Refinitiv.
Chart data in accessible format.
Figure 4: Global supply chain pressure index, standard deviations from average value
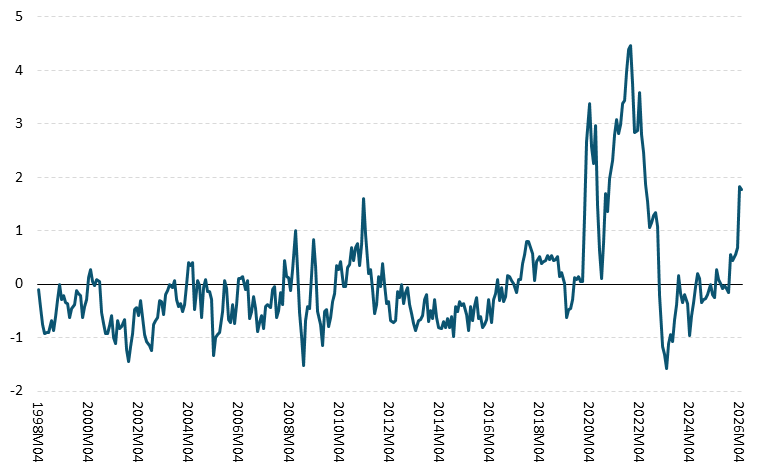
Source: New York Federal Reserve.
Note: Last observation is May 2026.
Chart data in accessible format.
Implications for the Global Economy and Ireland
The most immediate macroeconomic transmission is the rise in energy prices. Higher oil and gas prices act as a supply-side shock to the global economy: they raise production costs across energy-intensive sectors including petrochemicals, manufacturing,
transport and agriculture. This feeds through to higher input prices for firms and consumer price inflation for households. Higher production costs and weaker purchasing power in turn lowers economic activity. The impact is unevenly distributed across
countries. Asia-Pacific energy importers such as Japan, South Korea and India with high dependence on the Gulf bear the greatest direct exposure through higher energy and commodity import prices. European economies face elevated oil, gas and manufacturing
input costs. The US, as a major oil and gas producer, is better insulated on energy but not immune to the global demand and financial market effects of a sustained shock. Emerging market and developing economies (EMDEs) face a dual pressure of higher
energy and food import bills alongside tighter global financing conditions.
Reflecting these effects, forecasts for inflation have been revised up and growth revised down for most of the world’s major advanced economies since the outbreak of the war. In its latest World Economic Outlook published in April 2025,
the IMF revised down its projection for overall global growth by 0.2 per centage points for 2026 with inflation revised up by 0.6 percentage points (see External Environment). Ireland's export base is dominated by pharmaceuticals, technology
and financial services and is deeply embedded in global value chains. The composition of Irish trade, in particular the dominance of pharmaceuticals in overall goods exports, would provide some mitigation against weaker global growth as trade in these
products tends to be less sensitive to cyclical economic conditions.
Ireland’s direct trade with the Middle East is very small, with the direct exposure mostly related to its high energy import dependency. Ireland imported approximately €7.5 billion of mineral fuels in 2025, representing 5.2 per cent of total
goods imports — of which €570 million was directly from the Middle East, with jet fuel accounting for most of that value (Table 2).
However, the indirect effects of the conflict in the Middle East are more its importance as a source for commodities that are traded globally, such that any disruption to supply from that region will be reflected in the global price faced by Irish importers
irrespective of where the commodity is imported from. The increase in the price of imported goods may ultimately be passed on to producer prices and consumer price inflation. The AIB Ireland PMI input price indices for manufacturing, services, and
construction all surged sharply in March and April 2026, with the manufacturing input prices index reaching 74 in April and construction input prices reaching 79. These are among the highest readings recorded outside of the pandemic disruption period
in 2021 and 2022.
It is useful to distinguish between the possible effects on MNE-dominated sectors and indigenous firms. Pharmaceuticals and ICT manufacturing account for around three quarters of total goods exports and less than 5 per cent of employment combined. These
sectors are exposed to higher energy prices but account for a relatively small share of total energy use – chemicals and pharmaceuticals accounted for around 2 per cent of energy consumption across all sectors in 2023. Aside from exposure to energy, the Gulf is an important global supplier of hydrocarbons and helium which are used, respectively, in the manufacture of some pharmaceutical and semiconductor goods. This means that increases in the price of these inputs
or shortages of supply could potentially affect these sectors in Ireland to the extent these goods are important inputs to production. An analysis of detailed import data indicates these exposed products – helium and hydrocarbon derivatives
– account for very small shares of total goods imports in Ireland and, of the value of the goods imported, the share sourced from the Middle East is low (Table 2). Despite this low direct import exposure, these sectors in Ireland would still
be adversely affected by disruption to the supply of these important inputs globally, or the raw materials used to produce them, as well as the increase in freight and transportation costs. An important mitigating factor for the MNE-dominated sectors
is the high value-added nature of their production in Ireland and related high profit margins which provides some scope to absorb increases in costs.
In contrast to MNEs, indigenous firms account for around one quarter of value added but the majority (around three quarters) of employment in Ireland. Some indigenous firms are likely to be operating in more energy-intensive sectors than MNEs. Construction,
wholesale and retail trade and accommodation and food are three sectors with a significant presence of indigenous firms. Together these sectors represent about 25 per cent of employment and in 2023 accounted for just under 6 per cent of energy consumption
by all businesses, three times the figure for the chemicals and pharma sector. While not as export and import intensive as foreign MNEs, over 80 per cent of workers in Irish-owned firms in manufacturing, wholesale and retail trade participate in international
trade. These exporters are more likely to serve the EU and UK than the US market (Central Bank of Ireland, 2025).
Indigenous firms are not as reliant on international value chains as foreign-owned MNEs, but still have considerable exposure to the effects of the war through the impact on the price of intermediate inputs and the level of demand in their key continental
European markets. Relative to MNEs, indigenous firms tend to be smaller and have lower value added per worker, reducing their capacity to absorb higher costs.
Risks
The risks to the outlook are materially skewed to the downside. A more prolonged closure of the strait, renewed escalation of hostilities, or lasting damage to Gulf region energy infrastructure could sustain commodity prices well above the baseline and
extend disruptions to global supply chains. Another consideration is that the current disruption in energy markets is more global than that which followed Russia’s invasion of Ukraine in 2022, as the latter was a more Europe-centric shock. Model-based
analysis by the ECB shows that, compared with a regional shock, a global energy shock has a more adverse impact on EU output. This is because a global shock not only directly raises
the price of imported energy but also indirectly raises the price of all energy-intensive imported goods. A continuation of the current disruption would therefore negatively affect all firms, but with indigenous sectors of the economy potentially
more exposed. The ultimate macroeconomic impact of the conflict will be determined by two factors currently unknown: its intensity and its duration. The Balance of Risks sets out the implications for the economy of two scenarios involving
a more prolonged Middle East war as well as a milder scenario.
Table 2: Value of Irish goods imports in 2025
| Commodity |
2025 goods imports (€mn) |
Share of goods imports (%) |
Share imported from Middle East (%) |
| Total |
142,900 |
100.00 |
2.80 |
| Energy |
7,489 |
5.24 |
7.60 |
| Oil |
5,029 |
3.52 |
11.31 |
| Crude petroleum |
1,549 |
1.08 |
0.00 |
| Jet fuel (kerosene) |
984 |
0.69 |
55.22 |
| Gas |
1,650 |
1.15 |
0.01 |
| Natural gas |
1,581 |
1.11 |
0.00 |
| LNG |
3 |
0.00 |
0.00 |
| Chemicals |
37,521 |
26.26 |
0.22 |
| Medicinal & pharma products |
22,699 |
15.88 |
0.01 |
| Organic chemicals |
6,853 |
4.80 |
0.37 |
| Derivatives of hydrocarbons |
5 |
0.00 |
0.00 |
| Inorganic chemicals |
575 |
0.40 |
3.37 |
| Rare gases |
37 |
0.03 |
0.14 |
| Helium |
33 |
0.02 |
0.16 |
| Neon, krypton and xenon |
4 |
0.00 |
0.00 |
| Fertilisers (excl. 272) |
643 |
0.45 |
0.00 |
| Urea |
139 |
0.10 |
0.00 |
| Crude materials |
1,348 |
0.94 |
0.05 |
| Crude fertilisers (excl. 56) |
251 |
0.18 |
0.12 |
| Manufactured goods |
8,332 |
5.83 |
0.26 |
| Metals |
4,028 |
2.82 |
0.38 |
Source: CSO (TSA06), Eurostat (ds-059331, ds-059341, ds-045409), author’s calculations.
An Timpleallacht Gheilleagrach
Tá dúshláin agus móréiginnteacht ag bagairt ar an ngeilleagar domhanda i gcónaí mar gheall ar an gcoinbhleacht sa Mheánoirthear, agus tá an saobhadh i gCaolas Hormuz ag dul isteach sa cheathrú mí anois. Sa mhalairt treo, tá infheistíocht leanúnach chaipitil a bhaineann leis an Intleacht Shaorga ag tacú le gníomhaíocht eacnamaíoch dhomhanda, rud atá follasach i ngeilleagar na hÉireann freisin. Fiú nuair a bheidh réiteach iomlán ar an gcoinbhleacht, togfaidh sé tamall fada slabhraí soláthair a chur ar bun arís. Dá réir sin, bhí luaineacht shuntasach ar phraghsanna spotola agus ar thráchtearraí gaolmhara agus bhí dúshláin níos seasmhaí roimh an soláthar, rud is cionsioncair leis an ionchas níos airde i leith praghsanna fuinnimh i gcoitinne. I gcás na hÉireann, tá fíorioncaim na dteaghlach á laghdú agus muinín na dtomhaltóirí á maolú ag costais fuinnimh níos airde, fad atá na costais sin á gcur ar aghaidh chuig brúnna boilscitheacha níos leithne. Baineann rioscaí casta leis an gcoinbhleacht do shlabhraí soláthair domhanda eile taobh amuigh den fhuinneamh, agus d’fhéadfadh éifeachtaí iarmhartacha a bheith acu sin ar chostais táirgthe agus ar ghníomhaíocht eacnamaíoch. I bhfianaise an méid sin, tá dúshlán dúbailte roimh an mbeartas eacnamaíoch intíre, eadhon tacaíocht a thabhairt dóibh siúd is leochailí agus a chur ar chumas na dteaghlach agus na ngnólachtaí athléimneacht a chothú in aghaidh na dturraingí sin i gcoitinne, fad a sheachnófar bearta lena gcuirfear leis an éileamh nó lena ndaingneofar bearta boilscitheacha laistigh den gheilleagar.
Mar gheall ar na forbairtí sin, tá athruithe ábhartha tagtha ar an ionchas eacnamaíoch a bhí ann roimh an gcoinbhleacht, le tuairimí éagsúla ar chaiteachas tomhaltóirí agus ar infheistíocht ghnó, go háirithe in 2026. Tuartar go maolóidh éileamh modhnaithe intíre (MDD) thar thréimhse na réamhaisnéise, rud a léiríonn éifeachtaí maolaitheacha praghsanna fuinnimh níos airde ar fhíorioncaim agus ar thomhaltas. Meastar, áfach, go gcuirfidh neart na hinfheistíochta faoi stiúir FIN le fás foriomlán MDD thar thréimhse na réamhaisnéise. Tá athbhreithniú aníos déanta ar na réamhaisnéisí boilscithe go 3.5 faoin gcéad i mbliana agus go 2.9 faoin gcéad in 2027, agus tá an t-ionchas do phraghsanna fuinnimh i bhfad níos airde ná mar a measadh san Fhaisnéis Ráithiúil i mí an Mhárta. Tá éiginnteacht fíor-ard ag baint leis na réamhaisnéisí bonnlíne sin, áfach, agus tá rioscaí ann i gcónaí atá claonta ar an taobh thíos don fhás agus ar an taobh thuas don bhoilsciú.
I bhfianaise mhéid na héiginnteachta, cuireann an Fhaisnéis Ráithiúil seo cásanna malartacha i láthair d’fhonn raon na dtorthaí féideartha a léiriú. Sa chás níos séimhe, áit a nglactar leis go réiteofar an choinbhleacht go tapa, tiocfaidh laghdú ar phraghsanna ola agus gáis faoi bhun na bpraghsanna sin a mheastar sa réamhaisnéis bhonnlíne, rud a thacóidh le fás atá beagán níos láidre agus boilsciú níos ísle. Ach fiú sa chás seo, tá éifeachtaí an chur isteach a bhí ann cheana féin ó thús an chogaidh fós ag cur brú aníos ar bhoilsciú i gcoibhneas leis an méid a raibh coinne leis roimh an gcoinbhleacht. Sa chás tromchúiseach, glactar leis go mbeadh praghsanna tráchtearraí fuinnimh agus bia ard ar bhonn seasmhach, go sroichfeadh boilsciú ardléibhéil shuntsacha - ag druidim le 5 faoin gcéad in 2027 - fad a bheadh moilliú suntasach ar fhás. De bhreis ar iarmhairtí díreacha ar phraghsanna fuinnimh, baineann impleachtaí níos leithne leis an gcoinbhleacht do shlabhraí soláthair domhanda freisin (Bosca C). Tá méaduithe géara tagtha ar phraghsanna táirgí dianfhuinnimh a tháirgtear i réigiún na Murascaille, amhail leasacháin agus héiliam – ar ionchur criticiúil é héiliam i monarú leathsheoltóirí – agus tá impleachtaí iarmhartacha aige sin do phraghsanna do thomhaltóirí. D’fhéadfadh aon ghéarú suaití níos fairsinge a spreagadh, rud nach gcuirtear in iúl sna cásanna atá foilsithe san Fhaisnéis Ráithiúil seo. Tá difríocht mhór idir na héifeachtaí sna hearnálacha éagsúla: tá éiginnteacht mhéadaithe maidir le costais ionchuir agus éileamh onnmhairiúcháin i ndán d’fhiontair ilnáisiúnta, fad a fhéadfaidh go mbeidh cumas níos teoranta ag gnólachtaí dúchasacha costais mhéadaitheacha ionchuir a iompar, agus fad atá teaghlaigh níos neamhchosanta ar bhrúnna a bhaineann le costais mhaireachtála.
I bhfianaise an chúlra éiginnte seo, léirigh na réamhshonraí cuntas náisiúnta do R1 2026 cineál déach gheilleagar na hÉireann. Tháinig fás láidir ar an éileamh modhnaithe intíre, rud a bhí faoi thionchar go mór ag infheistíocht ilnáisiúnta den chuid is mó, go háirithe in IS agus in earraí caipitil a bhaineann le hionaid sonraí. I gcodarsnacht leis sin, tháinig cúngú géar ar OTI príomha le linn na ráithe, rud a léiríonn na bunéifeachtaí ó na luascthaí luaineacha ar onnmhairí hormón polaipeiptíde anuraidh agus ón gcúngú ar thrádáil earraí thar lear. Léiríonn na héagsúlachtaí sin an gá atá le nithe eile a chur san áireamh de bhreis ar thomhais phríomha chun an fuinneamh bunúsach faoin ngeilleagar intíre a thuiscint.
Tá ról rómhór ag FINanna i gcónaí, ní hamháin san infheistíocht agus in onnmhairiú ach in ioncaim cánach chomh maith, fad atá siad feiceálach sa mhargadh saothair freisin. Bhí an fás ar fhostaíocht á spreagadh go mór ag an earnáil cógaisíochta agus an earnáil TFC le blianta beaga anuas, go háirithe i gcás oibrithe a bhfuil ardcháilíochtaí acu (Bosca B). Tá méadú suntasach tagtha ar sciar na n-oibrithe a bhfuil cáilíochtaí tríú leibhéal acu le deich mbliana anuas, rud atá á spreagadh ag na hearnálacha FIN seo. Tá éagsúlacht mhór idir na hearnálacha seo ó thaobh pátrúin earcaíochta idirnáisiúnta, sa mhéid go mbíonn TFC ag brath níos mó ar oibrithe atá lasmuigh den AE. Ina theannta sin, rannchuidíonn na hearnálacha sin go díréireach le hioncam ó cháin chorparáide freisin, sa mhéid gurb ionann TFC agus cógaisíocht agus os cionn leath den ioncam uile ó cháin chorparáide, aníos go mór ó 2019. Cruthaíonn sé seo leochaileachtaí fioscacha suntasacha, go háirithe i bhfianaise na luaineachta agus na héiginnteachta a bhaineann le treochtaí infheistíochta agus fostaíochta amach anseo sna hearnálacha soghluaiste domhanda seo.
Bhí infheistíocht láidir, go háirithe in IS agus i ngníomhaíocht a bhaineann le hionaid sonraí, mar bhonn faoi neart an éilimh mhodhnaithe intíre le linn 2025 go luath in 2026. Tá méadú tagtha le blianta beaga anuas ar allmhairí de chrua-earraí ionad sonraí atá nasctha leis an intleacht shaorga, sa chaoi gurb ionann iad agus níos mó ná leath den infheistíocht mhodhnaithe in innealra agus i dtrealaimh (Bosca A). Le scála na gníomhaíochta infheistíochta sin, i dteannta fás láidir foriomlán ar fhás le blianta beaga anuas, tá an geilleagar ag feidhmiú gar dá lánacmhainneacht go luath sa bhliain 2026. Is cosúil go bhfuil maolú ag teacht ar an margadh saothair anois, áfach. Tá an fás ar fhostaíocht ag maolú, tá fógraí post ag laghdú i gcónaí, agus tá méadú beag tagtha ar an ráta dífhostaíochta. Tá laghdú tagtha ar na hionchais maidir le fíorphá, agus ní mheastar go gcoinneoidh fás ainmniúil pá suas leis an mboilsciú sa ghearrthéarma, rud a chuirfidh le meath ar mhuinín na dtomhaltóirí. Meastar go dtiocfaidh maolú breise ar an bhfás ar thomhaltas pearsanta de réir mar a leanfaidh praghsanna ardaithe fuinnimh d’fhíorioncaim indiúscartha teaghlaigh a laghdú. Léiríonn sé seo comhthéacs atá éagsúil leis an turraing praghsanna fuinnimh a chonacthas i ndiaidh ionradh na Rúise ar an Úcráin, tráth a bhí an margadh saothair ag cúngu, rud a chuir le fás pá an tráth sin.
Tá athbhreithniú mór aníos déanta ar fhás ar phraghsanna fuinnimh i ndiaidh na méadúithe ar thoimdí maidir le praghsanna mórdhíola ola agus gáis agus na méaduithe a fógraíodh ar phraghsanna fóntais. Tá éifeachtaí díreacha ar bhoilsciú príomha le feiceáil go soiléir, agus tá fuinneamh ag cur go mór leis sin. Mar sin féin, tá fianaise ann freisin go bhfuil éifeachtaí indíreacha ann de réir mar a chuirtear costais níos airde fuinnimh ar aghaidh chuig costais táirgthe ar fud earraí agus seirbhísí, agus go bhfuil méadú ag teacht ar chostais iompair agus méadú mór ag teacht ar phraghsanna táirgí dianfhuinnimh. Tá boilsciú seirbhísí ardaithe i gcónaí, rud a léiríonn go páirteach tarchur na gcostas ionchuir níos airde agus, chomh maith leis sin, éileamh intíre leanúnach agus brúnna pá. Is é an príomhriosca go bhféadfadh éifeachtaí indíreacha teacht chun cinn, trína lorgaíonn oibrithe cúiteamh as laghdú pá trí éilimh níos airde ar phá ainmniúil, agus trína gcuireann gnólachtaí na costais saothair níos airde sin ar aghaidh chuig praghsanna do thomhaltóirí chun corrlaigh bhrabúis a choinneáil ar bun. Cé nach bhfuil aon fhianaise ann maidir le héifeachtaí forleathana indíreacha go dtí seo, tá riosca suntasach ann i gcónaí, go háirithe má bhíonn suaitheadh fuinnimh níos seasmhaí i gceist nó má thagann gearú breise ar an gcoinbhleacht.
Ar leibhéal an limistéir euro, táthar ag freagairt do bhrúnna ardaithe boilscitheacha leis an mbeartas airgeadaíochta chun a chinntiú go gcobhsóidh boilsciú go hinbhuanaithe ag an sprioc arb ionann í agus 2 faoin gcéad sa mheántéarma. I mí an Mheithimh, d’ardaigh an Chomhairle Rialaithe na trí eochair-ráta úis dá cuid faoi 25 bhonnphointe. Tá an géarú ar an mbeartas spreagtha ag an méadú mór ar phraghsanna fuinnimh agus ag na héifeachtaí indíreacha a bhíonn acu sin ar an mboilsciú níos leithne. Tá breithnithe na Comhairle Rialaithe ag brath ar shonraí i gcónaí agus leanfaidh an Chomhairle de mheasúnú a dhéanamh ar fhaisnéis a thagann isteach agus ar bhonn cruinniú ar chruinniú.
Ó thaobh an bheartais intíre de, is gá go mbeidh mar thosaíocht athléimneacht agus inbhuanaitheacht an airgeadais phoiblí a neartú agus tacú ag an am céanna leis an ngeilleagar dul i ngleic leis an suaitheadh fuinnimh. Mar a chuirtear in iúl in Alt Sínithe a ghabhann leis an bhFaisnéis Ráithiúil seo, bhí méaduithe suntasacha le blianta beaga anuas ar chaiteachas athfhillteach rialtais i dteanna spleáchas méadaitheach ar cháin chorparáide, arb ionann anois é agus beagnach an ceathrú cuid d’ioncam iomlán rialtais. Nuair a eisiatar an cháin chorparáide bhreise mheasta, tá méadú suntasach tagtha ar an easnamh bunúsach buiséid. Sháraigh fás caiteachais na pleananna buiséid tosaigh le cúig bliana anuas, rud a d’fhág go raibh caiteachas foriomlán an rialtais ag fás de réir rátaí a bhí i bhfad os cionn na rátaí a bheadh ag teacht le hacmhainneacht inbhuanaithe mheasta an gheilleagair. Is ábhar mór imní i gcónaí é nach bhfuil crann taca fioscach éifeachtach ann. Tá sé ríthábhachtach go gcloífear le riail inchreidte chaiteachais lena ndéanfar fás caiteachais a ailíniú le ráta fáis treochta an gheilleagair chun beartas fioscach fritimthriallach éifeachtach a bhunú agus chun an t-airgeadas poiblí a chur ar chonair inbhuanaithe. Tá tábhacht ar leith ag baint leis seo i bhfianaise brúnna struchtúracha a bhaineann le daonra atá ag dul in aois, riachtanais bonneagair, agus leochaileachtaí ó bhonn cánach comhchruinnithe. Agus an geilleagar ag feidhmiú gar dá lánacmhainneacht, níor cheart tuilleadh éilimh a spreagadh leis an mbeartas buiséadach. Ba cheart go mbeadh aon bhearta tacaíochta breise do theaghlaigh leochaileacha spriocdhírithe agus saincheaptha, agus go bhfreastalófar orthu as na leithdháiltí buiséadacha atá ann cheana. An tráth céanna, dá dtabharfaí aghaidh ar leochaileachtaí ón mbonn cánach cúng, bheadh sé comhlántach le cobhsaíocht mhacrairgeadais a choinneáil ar bun, agus bheadh raon leathan féidearthachtaí ann lena n-áirítear athbhreithniú a dhéanamh ar fhaoisimh chánach, ar thomhaltas agus ar chánacha maoine agus ar ranníocaíochtaí árachais shóisialta.
De bhreis ar smacht fioscach, tá sé riachtanach dul i ngleic le srianta soláthair d’fhonn tacú le feabhas a chur ar fhás inbhuanaithe agus ar chaighdeáin mhaireachtála. Ta srianta ceangailteacha i ndán don gheilleagar maidir le tithíocht, fuinneamh, uisce, fuíolluisce, agus bonneagar iompair. Tá na srianta seo ag cur teorainn leis an ngíomhaíocht eacnamaíoch reatha agus ag laghdú ráta fáis ionchasach an gheilleagair. Tacaíocht níos inbhuanaithe a bheadh i gceist le bearta lena laghdófaí spleáchas ar bhreoslaí iontaise, rud a chuideodh le hathléimneacht a chothú in aghaidh suaití geopholaitiúla amach anseo agus a rannchuideodh le spriocanna i ndáil le laghduithe astaíochtaí ag an am céanna. Thacófaí go hinbhuanaithe le fás fadtéarmach dá ndéanfaí ráta infheistíochta níos airde ag teaghlaigh agus ag gnólachtaí dúchasacha a chruinniú isteach trí chaiteachas caipitil phoiblí arna gcistiú go cuí agus a dtabharfaí tosaíocht dó. Tá an caiteachas atá beartaithe faoin bPlean Forbartha Náisiúnta ceaptha dul i ngleic leis na ganntanais sin, agus fáiltítear roimh athchóirithe amhail na cinn a leagtar amach sa Tuarascáil agus Plean Gníomhaíochta um Luathú Bonneagair. D’fhonn na pleananna seo a bhaint amach, beidh gá le hiarracht leanúnach, bainistíocht tionscadal éifeachtach, agus toilteanas chun dul i ngleic le baic fhadtéarmacha. I bhfianaise go bhfuil dálaí eacnamaíocha sách fabhrach i gcónaí d’ainneoin roinnt constaicí le déanaí, tá deis ann athléimneacht an airgeadais phoiblí agus an gheilleagair a fheabhsú i leith na mbrúnna struchtúracha agus na dturraingí seachtracha atá romhainn.
Endnotes