Behind the Data – Did Ireland’s Financial Sector Actively Shift its US Asset Allocation Following April’s Tariff Announcements?

Barra McCarthy, Bruno de Freitas Andrade, Joseph O'Connor*
September 2025
This Behind the Data explores whether the Irish financial sector responded to the sudden increase in US economic policy uncertainty in April 2025 by reducing its exposure to US assets over Q2 2025. Using granular data spanning investment funds, banks, insurance companies and pension funds, we find little evidence of active reductions in exposure to US bonds and equities across the financial sector, but we find evidence of an increase in hedging activity of US dollar exposures.
The announcement of tariffs by the US government in April 2025 ignited turmoil in US financial markets, including a depreciation in the US dollar and rising US Treasury yields. This, led to a market narrative emerging that investors were reducing their exposure to US assets, referred to as the ‘Sell America’ trade (Aspan, 2025). This market narrative was reflected in a survey of global fund managers in May, which reported that their portfolio share of US dollar exposures relative to the global share of US assets was at its lowest since 2006 (Reuters, 2025), and more anecdotally, in press reporting around sustained inflows into investment funds that excluded US assets (Johnson, 2025). Foreign investors reducing their exposures to US assets would have implications for international capital flows, borrowing costs and asset valuations, and would occur both for US issuers and for any issuer who received investment directed away from the US.
This Behind the Data provides an initial assessment of whether the Irish financial sector systemically reduced its exposure to US assets over the second quarter of 2025. Looking across banks, insurance corporations, investment funds and pension funds, it calculates changes in the share of US assets in their portfolios and whether these changes were driven by transactions or asset valuations. It also explores whether these sub-sectors responded to heightened uncertainty by increasing their hedging of the US dollar, and how trends observed in Ireland’s financial sector align with global trends on investment into US assets. While Ireland’s financial sector forms only a part of the global financial system, its position as a channel for global finance means it may be informative as to trends beyond Ireland.
It finds that across the sub-sectors of Ireland’s financial sector, US assets’ portfolio share saw limited declines over the quarter, which were not exceptional relative to quarter-on-quarter changes observed since 2019. All sub-sectors experienced lower revaluations for their US assets than for their total portfolios, reflecting the relatively poorer performance of US assets over Q2 2025. Insurance companies and investment funds had a lower rate of transactions into US assets than the transaction rate for their total portfolios, which suggests that, in aggregate, these sectors made a conscious decision to reduce exposure to US assets. The limited declines align with US data which indicates international investors net sold US securities in April 2025, but this changed to net purchases for the rest of Q2.
The Data
Granular balance sheet data from Ireland’s financial institutions, collected by the Central Bank, are used to understand changes in the portfolio share of US assets across sub-sectors. These include the Money Market and Investment Fund Return for investment funds, the Survey of Credit Institutions for banks, the Solvency II Return for insurance corporations and the Pension Funds Return for pension funds. These datasets provide details on stocks, transactions and revaluations of assets, which allows for the exploration of changes in US assets’ portfolio share.1
Analysis is focused on portfolio shares rather than euro amounts, as changes in euro amounts may reflect increases or decreases in money flowing into a sub-sector. For example, an investment fund manager may decide to decrease their exposure to US equity from 60% of fund assets to 55% of fund assets. However, the euro amount invested in US equity could still rise if there was substantial investment into the fund (i.e. greater than 9.1% of assets), even though the fund manager is reducing the amount they will invest in US equities.
Data on currency derivatives and international capital flows are also used to provide additional context on changes in US portfolio shares. The EMIR dataset provides granular daily reporting of derivative contracts entered into in the European Union. It is analysed to determine if Irish financial institutions increased their use of currency derivatives to protect (i.e. hedge) against decreases in the value of the US dollar – an alternative response to heightened uncertainty. US Treasury International Capital System data is analysed to compare Irish financial sector trends with global investment flows into US assets over Q2 2025.
Recent History of US asset allocation and Q2 Response
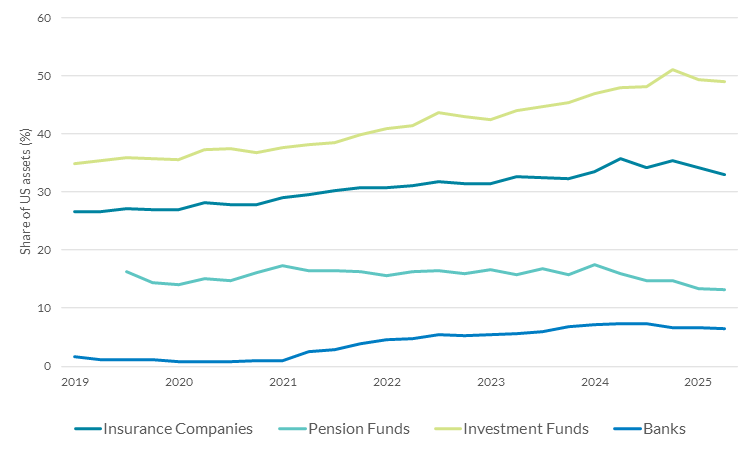
In the preceding six years to 2025, most of Ireland’s financial sector witnessed a trend of generally rising allocation to US assets (see Chart 1). This was most pronounced for investment funds - between 2019 and end-2024, the share of their portfolio accounted for by US issuers increased from 35% to 51%. Over the same period, insurance companies increased their allocation to US assets from 27% to 35%, while banks saw their allocation increase from 2% to 7%. This period of growth coincided with US stocks outperforming the rest of the world. For insurance companies and investment funds the rising share was largely driven by increased holdings of US equities, while for banks it was due to persistent investment in US bonds.
The share of banks, insurance companies and funds’ portfolios accounted for by US issuers has been on an upward trend since 2019.
Chart 1: Share of US assets in portfolio by sub-sector of Irish financial sector

Source: Solvency II Return, Money Market and Investment Fund Return, Pension Fund Return, Survey of Credit Institutions – Central Bank of Ireland
Notes: Share of US assets is calculated as the sum of debt and shares (excl. investment funds) with a US issuer over the sum of all debt and shares held by a cohort of financial institutions
Accessibility: Get the data in accessible format (XLSX 26.14KB)
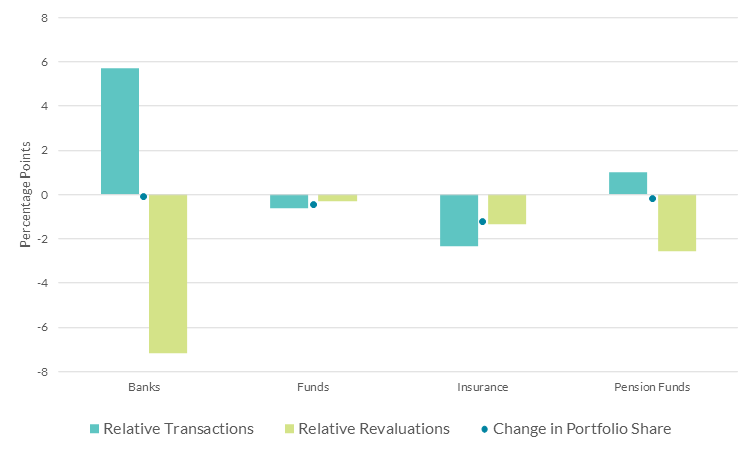
Allocation to US assets declined for all parts of Ireland’s financial sector in Q2 2025. Insurance corporations recorded the largest decrease of 1.2 percentage points, while banks experienced the smallest at 0.1 percentage points. These movements were not exceptional – all sub-sectors have recorded larger quarter-on-quarter declines since 2019. Overall, the data does not indicate a material reallocation away from US assets during the quarter.
Changes in the share of US assets in a given portfolio are driven by the rate of transactions or revaluations for US assets, relative to the rate of transactions or revaluations for the total portfolio. The rate of transactions/revaluations is measured as transactions/revaluations in the current period divided by the previous period’s stock position. If net transactions into US assets amount to 1% of the previous stock of US assets and net transactions for all assets amount to 2% of the previous stock of total assets, the share of US assets in the portfolio will decline (assuming no difference in revaluation rates). To assess these effects, ‘relative transactions/revaluations’ – defined as the rate of transactions or revaluations in US assets minus the portfolio rate – are calculated.2 Relative revaluations capture passive changes in asset valuations, while relative transactions reflect investment decisions.
Across sub-sectors, Irish financial institutions saw modest decreases in the share of their portfolio allocated to US assets.
Chart 2: Change in share of US assets from Q1-Q2 2025, and relative transactions and revaluations for US assets, by sub-sector of Irish financial sector

Source: Solvency II Return, Money Market and Investment Fund Return, Pension Fund Return, Survey of Credit Institutions – Central Bank of Ireland
Notes: Share of US assets is calculated as the sum of debt and shares (excl. investment funds) with a US issuer over the sum of all debt and shares held by a cohort of financial institutions.
Accessibility: Get the data in accessible format (XLSX 24.05KB)
All sub-sectors recorded negative relative revaluations for US securities, reflecting broad-based declines in US asset values and the US dollar. Banks experienced the largest negative relative revaluation at -7.2 percentage points, while investment funds recorded the smallest at -0.3 percentage points. Both investment funds and insurance corporations experienced more negative relative revaluations in Q1 2025, likely linked to the correction in US tech stocks.
Investment funds and insurance companies did not invest enough into US assets in Q2 to maintain their Q1 portfolio share. Investment funds and insurance companies saw relative transactions of -0.6 and -2.3 percentage points, respectively. This represented a series low for insurance corporations, but not for investment funds. This suggests that the change in the share of US assets for both sub-sectors reflects investment decisions, and not just differences in asset valuations. In euro amounts, investment funds were net purchasers of US securities, while insurance corporations recorded net sales of €1bn. In contrast, banks and pension funds reported positive relative transactions.
Taking a wider lens on investment activity – derivatives and international investment data
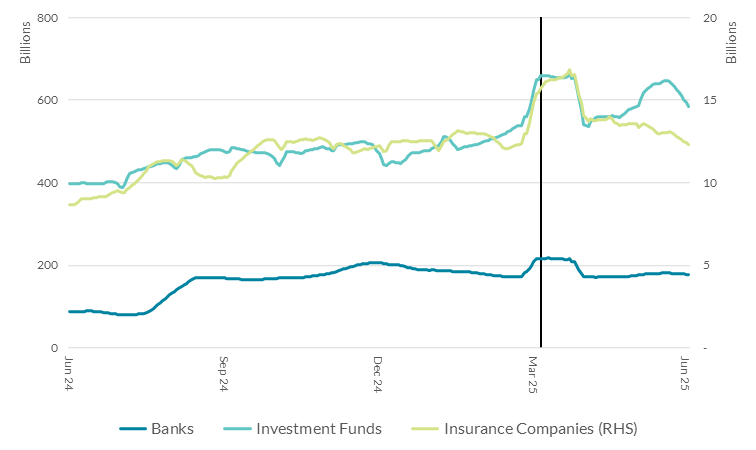
EMIR data shows a clear increase in the use of certain derivatives, currency forwards, to protect against decreases in the value of the US dollar by the Irish financial sector at the end of Q1 and into Q2 2025 (see Chart 3). Currency forwards allow a fixed amount (known as the notional) of one currency to be exchanged for another at a pre-agreed exchange rate at a future date. There is a gradual increase in the notional amount of derivatives which protect against decreases in the value of the US dollar across banks, insurance companies and investment funds over 2024 and into 2025. This increase accelerates towards the end of March, with investment funds and insurance companies seeing an approximate 30% increase in the rolling average of their notional amount between the start of March and the middle of April. It remains elevated for investment funds at the end of June (around $600bn) but returns to its level at the start of March for banks and insurance companies ($12bn and $175bn, respectively). The persistent increase in the notional amount is suggestive of an increased level of hedging by investment funds in response to heightened uncertainty.3
Ireland’s financial institutions increased their protection against unfavourable movements in US dollar exchange rates in the run up to April 2025.
Chart 3 – Gross Notional of Forward Contracts Hedging the US Dollar

Source: EMIR, Central Bank of Ireland
Notes: Figures are a rolling 20-day average. The gross notional of currency forwards hedging the US dollar captures forwards which allow an institution to sell US dollars at an agreed rate at a future date. Currency forwards are the dominant derivative type used to hedge foreign currency risk across the Irish financial sector. Pension funds cannot use derivatives. Black line is April 2nd 2025.
Accessibility: Get the data in accessible format (XLSX 49.1KB)
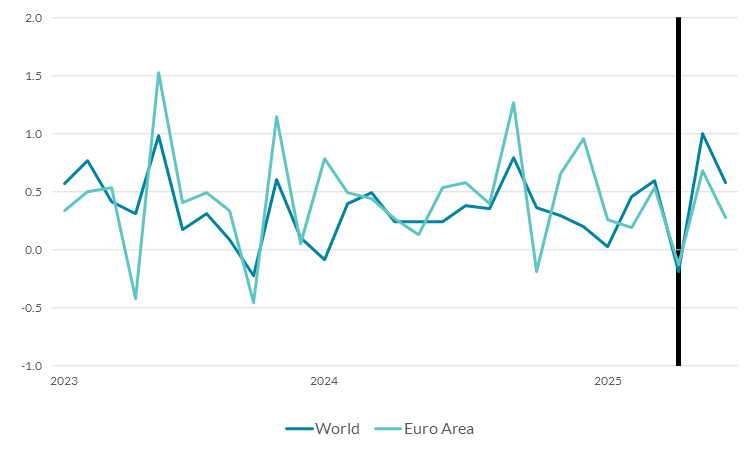
Treasury International Capital System data does not show international investment into US securities materially changing over Q2. Net sales of US securities in April 2025 amounted to 0.1% and 0.2% of the previous month’s holdings of US securities for euro area and all investors, respectively. However, this was more than offset by purchases in May and June (see Chart 4). Higher net sales figures than those in April 2025 have been observed since early 2023, suggesting April’s data was a normal observation.
Net sales of US securities by global investors over Q2 only occurred in April.
Chart 4 – Rate of Net Purchases of long-term US securities by country group

Source: Treasury International Capital System, US Department of the Treasury.
Notes: Rate is defined as current months net purchases divided by previous months holdings. Data include all US long term securities, including US treasuries, US agency bonds, US corporate and other bonds, and US corporate shares. Negative figures indicate net sales, while positive figures indicated net purchases. Black line is April 2025.
Accessibility: Get the data in accessible format (XLSX 25.27KB)
Conclusion
The data suggest there is little evidence of active reductions in exposure to US bonds and equities across the Irish financial sector. The portfolio share of US assets declined modestly across most parts of Ireland’s financial sector, with the largest decline amounting to 1.2 percentage points for insurance corporations, although part of that was driven by valuation changes. These limited decreases align with international data on foreign investment into US securities. There is though evidence of increased hedging activity by the Irish financial sector of dollar exposures in response to higher uncertainty.
*Email [email protected] if you have any comments or questions on this note. Comments from Jean Cassidy, Jenny-Osborne-Kinch and Robert Kelly are gratefully acknowledged. The views expressed in this note are those of the authors and do not necessarily reflect the views of the Central Bank of Ireland or the ESCB.
[1] Looking at the data an aggregate level, we cannot distinguish whether this is due to institutions with a base currency of US dollars hedging non-dollar liabilities or institutions with a base currency other than the US dollar hedging their dollar assets. Without comparison to these underlying assets/liabilities it cannot be stated for certain that the hedging ratio for any sub-sector has increased.
[2] This approach follows that taken by Raddatz and Schmukler (2012), who decompose changes in portfolio weights between periods into relative transactions and relative revaluations.
[3] The calculation of US portfolio share excludes investment fund shares. They are excluded because it is not possible to determine what an investment fund is investing in. For example, a US investment fund could be investing in euro area government bonds.
See also: